
The S&P 500 - A Peaceful Vegan Or Carnivorous Killer?
(Click on image to enlarge)
First off, I’d like to thank Geoff Bysshe for covering the Daily while we vacationed.
How many trading companies can claim that they have nonstop free daily content provided by all their chief officers so you never miss a blog?
It sure helped us go away with a clear mind. And as a result, we are back fully refreshed!
When we left, SPY (S&P 500) closed at 283.92. Today it closed at 288.36.
I wish I could say it was that easy-that the SPY is not only doing better than it did in early August but that it has bottomed since then as well.
However, there are two distinct possibilities looking at both the daily and weekly charts.
First is that we have bottomed above 280 based on the 200-Daily moving average and the August 5th low of 281.72.
The other possibility is that the support SPY has found at these levels is merely enough for the chart to complete a somewhat lopsided right shoulder of a head and shoulders top.
With Friday’s huge trading range, followed by today’s inside day and relatively narrow range, which direction do you choose, the T-Rex or the Brontosaurus?

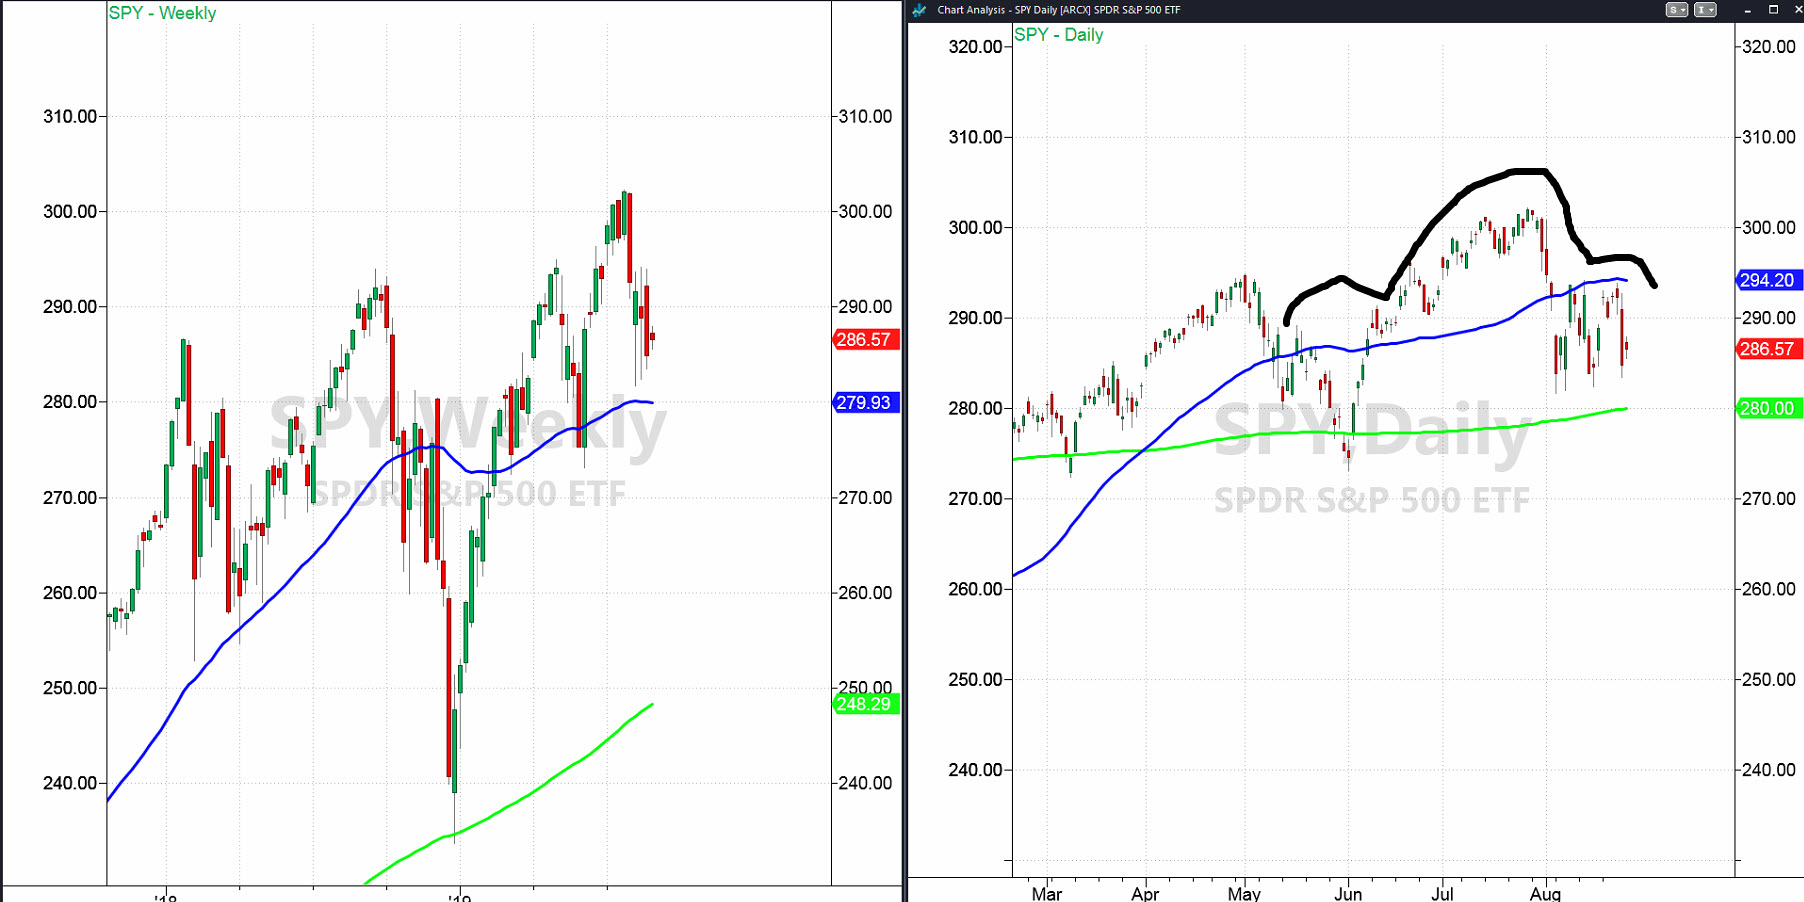
The chart on the left matches the dinosaur on the right.
The Weekly Chart illustrates more of the peaceful vegan SPY.
The blue line is the 50-weekly moving average.
With the last 3 weeks showing 3 consecutive higher lows along with its current bullish phase intact, our Brontosaurus SPY does not look quite so scary.
Nevertheless, do keep your eyes on the potential bear flag should SPY first break down under 284.75. That will be a
clue of further weakness to come.
In contrast, the chart on the right matches the dinosaur on the left.
Well under its 50-DMA yet above the 200-DMA, the black lines show what could turn out to be a nasty head and shoulders top.
A break of around 280 (which is the same area as the 50-WMA), will illustrate a much more carnivorous killer, or that of the dreaded Tyrannosaurus Rex.
Now, this is not my first foray into the dinosaur metaphor.
Some of you might remember the Rallysaurus or the dinosaur I used to describe how the 10-year old bull rally is hardly extinct.
What would make this rally go the way of the extinct dinosaur?
It will begin with a weekly close under 280. However, until we see a death cross on the daily chart and then a break of the 200-WMA, we are still calling this a correction.
Therefore, in spite of the nasty sell-off since August 5th, this basic sideways action merits very little trading action unless we see more bulls gobbled up by the T-Rex.
Or, we see the Brontosaurus and its plant-based diet, reignite the bulls. Technically, we want to see SPY have a weekly close over 290.
S&P 500 (SPY) Inside day. Big range from 280-290 must reconcile
Russell 2000 (IWM) Inside day. 148.25 resistance with nothing terribly exciting unless it clears 152-153. Downside key support at 145
Dow (DIA) Inside day. 263 key resistance and 256 very key support
Nasdaq (QQQ) Inside day. Also 2 inside weeks. 176.75 huge support with 185.50 point to clear and then 189
KRE (Regional Banks) Inside day. 46.23 is the monthly MA support-below a game changer for sure
SMH (Semiconductors) Inside day. Resistance at 115.75. 112.70 pivotal and 106.75
IYT (Transportation) Inside day. Under 175 more trouble.
IBB (Biotechnology) Inside day. Sitting on the 20 WMA at 102.71
XRT (Retail) Inside day. Under 37.80 more trouble
Disclosure: None.
If you'd like more information about the additional free trading education ...
more
Comments
 No Thumbs up yet!

