The Short-Term Uptrend Is Ready To Rally

Image Source: Pixabay
The short-term uptrend appears set to continue, and it looks ready to rally into year-end as the CNBC stock market watchers score points for predicting this one.
After such a rally, it may be very difficult for bears and late-comers to know what to do next. Get in now and possibly suffer losses during the next inevitable short-term downtrend? Or wait for the bottom of the next short-term downtrend and suffer through the disappointment of being on the sidelines while others celebrate their success?
So, what is my opinion on what to do? Own your mistakes and then resolve to follow the market indicators. The chart below shows the PMO near the top of the range, and because it has been up near its highs for a number of weeks, it suggests that it is a bit late to be buying and that the next short-term downtrend is too close to be risking cash in new positions.
It may be wish to watch this following chart every day for signs that prices are getting ready to pullback. The first step is to watch the five-day averages of the major indexes. There can be no pullback until these indexes start to close below their five-day averages.
It could be beneficial to watch the breadth indicators, too. I like to watch the bullish percents of the two major exchanges. As you can see, they showed significant strength last week, so there is little at the moment to suggest a new pullback. However, like the charts above, a close below their five-day averages would signal weakness.
I'm also watching the summations indicators. A close for the NYSE summation below the five-day, and I'm a seller.
Here is a look at a slightly different summation indicator, the NYSE common-stock-only summation. It has been a valuable market timing tool for me, and I'm likely to be a seller on the first red candle that shows up on this chart.
This past week was a big one for bonds, with the Fed Chair actually discussing rate cuts next year. As a result of his comments, there was a huge rally in bonds that included junk bonds, as you can see in the chart below. When junk bonds are doing well, small-caps are usually also doing well, and when small-caps do well, it is usually a good sign for the stock market in general. This is a bullish indicator.
The only worm in the apple that I can find for this stock market, at the moment, is in the chart below. The number of NYSE new 52-week lows has settled down to consistently harmless levels, and this is very bullish for stocks. However, the level of new lows for the Nasdaq is elevated.
Although the level of NYSE new lows is far more important than the level of Nasdaq new lows, it is still worrisome and it tells me that the market isn't as healthy as it could be. At some point, we'll find out why there are still so many Nasdaq new lows, but for now, we just have to acknowledge that it is an unexplained weakness in a strong stock market.
Bottom Line
I am about 75% long stocks and 25% cash. This small-cap ETF experienced a strong rally this past week, and it is now at a level of resistance where it could stall before breaking higher.
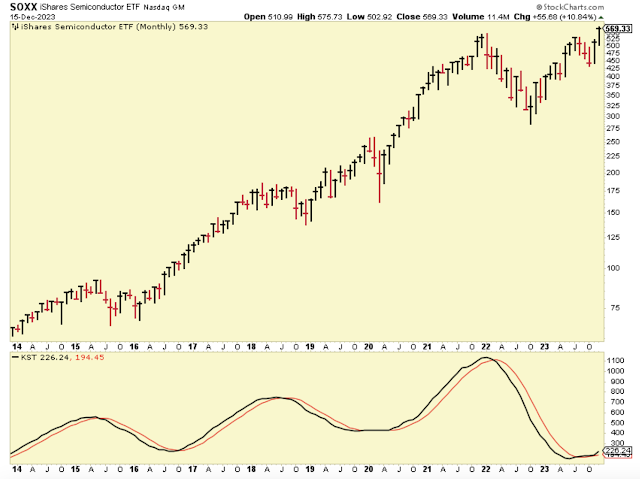
My favorite industry is the semiconductors, and this chart below shows you why. Have you ever seen such a bullish long-term chart? The ETF is pushing to new highs after breaking out of a multi-year, bullish cup-and-handle stock price pattern. In addition, the momentum indicator is just starting to curl higher off of a significant low. I'm a buyer.
Outlook Summary
- The short-term trend is up for stock prices as of Nov. 2.
- The ECRI Weekly Leading Index points to economic recovery as of July 2023.
- The medium-term trend is up for Treasury bond prices as of November 2023 (yields down, prices up).
More By This Author:
The Short-Term Uptrend Seems To Be Strengthening
How Long Can The Short-Term Uptrend Last?
The Short-Term Uptrend Has Remained Intact
Best Minds, Inc is a registered investment advisor that looks to the best minds in the world of finance and economics to seek a direction for our clients. To be a true advocate to our clients, we ...
more


I guess we headed to 600 on the $SOXX, I wouldn’t doubt it. The investing world has decided that next year is next year so whatever happens now is table stakes. Bearish