

Image Source: Pixabay
It was another solid day on Friday for indices, with the Russell 2000 building up some nice momentum. And other indices did not disappoint.
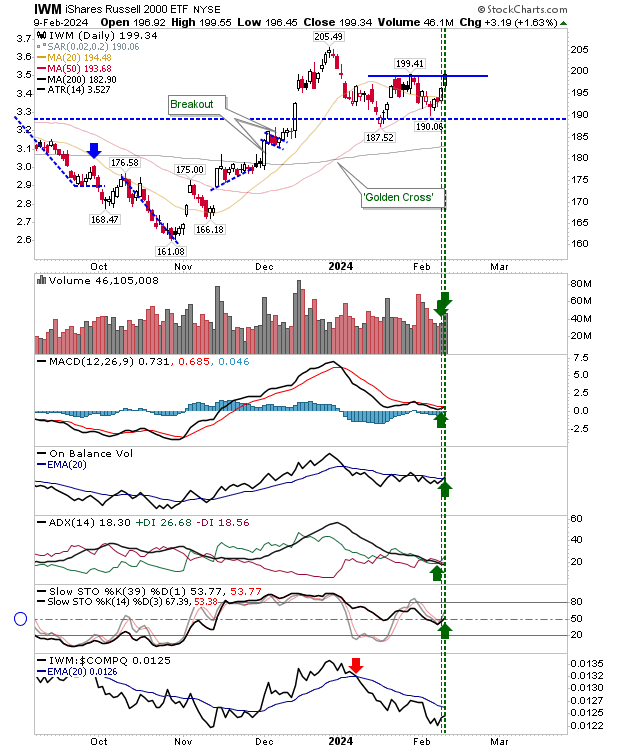
The Russell 2000 added over 1% as it reached resistance of the January swing high. Volume climbed to register a second day of accumulation in a row, increasing the probability of a breakout. Technicals returned net bullish, with new 'buy' triggers seen in the MACD and On-Balance-Volume.
This technical improvement coincided with a bounce from the intermediate stochastic midline, a typical bounce point in a cyclical bull market. While Monday may not deliver another gain, I will be looking for an end-of-day close near resistance.
(Click on image to enlarge)
Both the Nasdaq and the S&P 500 finished Thursday with narrow range doji formations that, at this stage of an advance, frequently mark a top. However, this was not the case, as by the close of business on Friday, both indices were able to post gains.
The Nasdaq sits 15.7% above its 200-day MA, which puts it above the 85% of historic price action for this index dating back to 1971, increasing the probability that a major top is not far away. We may be looking at a double top for this index, even if the index has just edged itself beyond the last peak in a potential bull market breakout. If this proves to be the case, then it will likely register as a 'bull trap.'

(Click on image to enlarge)
The S&P 500 is 12.6% above its 200-day MA, which is in the 90% zone of historic extreme price action dating back to 1950. This index has already surpassed the point where it could mark a double top, so if there is a top here, then I would be looking for a sequence of higher highs and higher lows in a pullback to the low 4000s.
Whereas I was of the opinion that the break of 4,766 marked an end of the bear market and would not undercut this level, this is looking less likely given the degree of extension beyond the 200-day MA.

(Click on image to enlarge)
While indices are approaching a level of heat often associated with market tops, we are still seeing good strength in the semiconductor index, an index that can continue to drive the broader rally in the S&P 500 and the Nasdaq.

(Click on image to enlarge)
For the coming week, we will want to see how selling -- when it comes -- impacts the new bull market breakouts, and whether these support levels can hold should sellers make a mark next week. Otherwise, we are going to keep drifting upwards.
More By This Author:
A Day The Russell 2000 Shone
Small Gains At 50-Day MA For Russell 2000
The Week Closed With Strong Gains On Higher Volume Accumulation


Comments
Log in or sign up to join the conversation.