
The Path Of Least Resistance - Are The Markets Ready For A Bigger Correction?

Image Source: PixaBay
Water always finds the path of least resistance, and from high cliffs, water cascades down in the form of splashing waterfalls. Since hitting new all-time highs late last year, the market indices have been slip-and-sliding since the beginning of 2022; although with energy stocks shooting up lately, things don't really feel so bad. But, really, let's ask ourselves honestly, what is "the path of least resistance" for the stock market near-term, say for the next 1-3 months?
The latest report placed inflation at 8.5%, the highest since 1981, which gave the Fed no room to be dovish towards the markets. Mostly analysts agree that we are in for a 50-basis-point rise in interest rate in May, and more raises to follow. Putin's war on Ukraine has pumped up the cost of oil and created geopolitical instability, with sanctions that will place pressure on the world economy (in addition to that of Russia). Of course, then, there is the (wise-)old saying, "Sell in May, Go away" - perhaps it is finally fitting this year?
Now, let's objectively dissect how the market indices look right now:
SPX
(Click on image to enlarge)
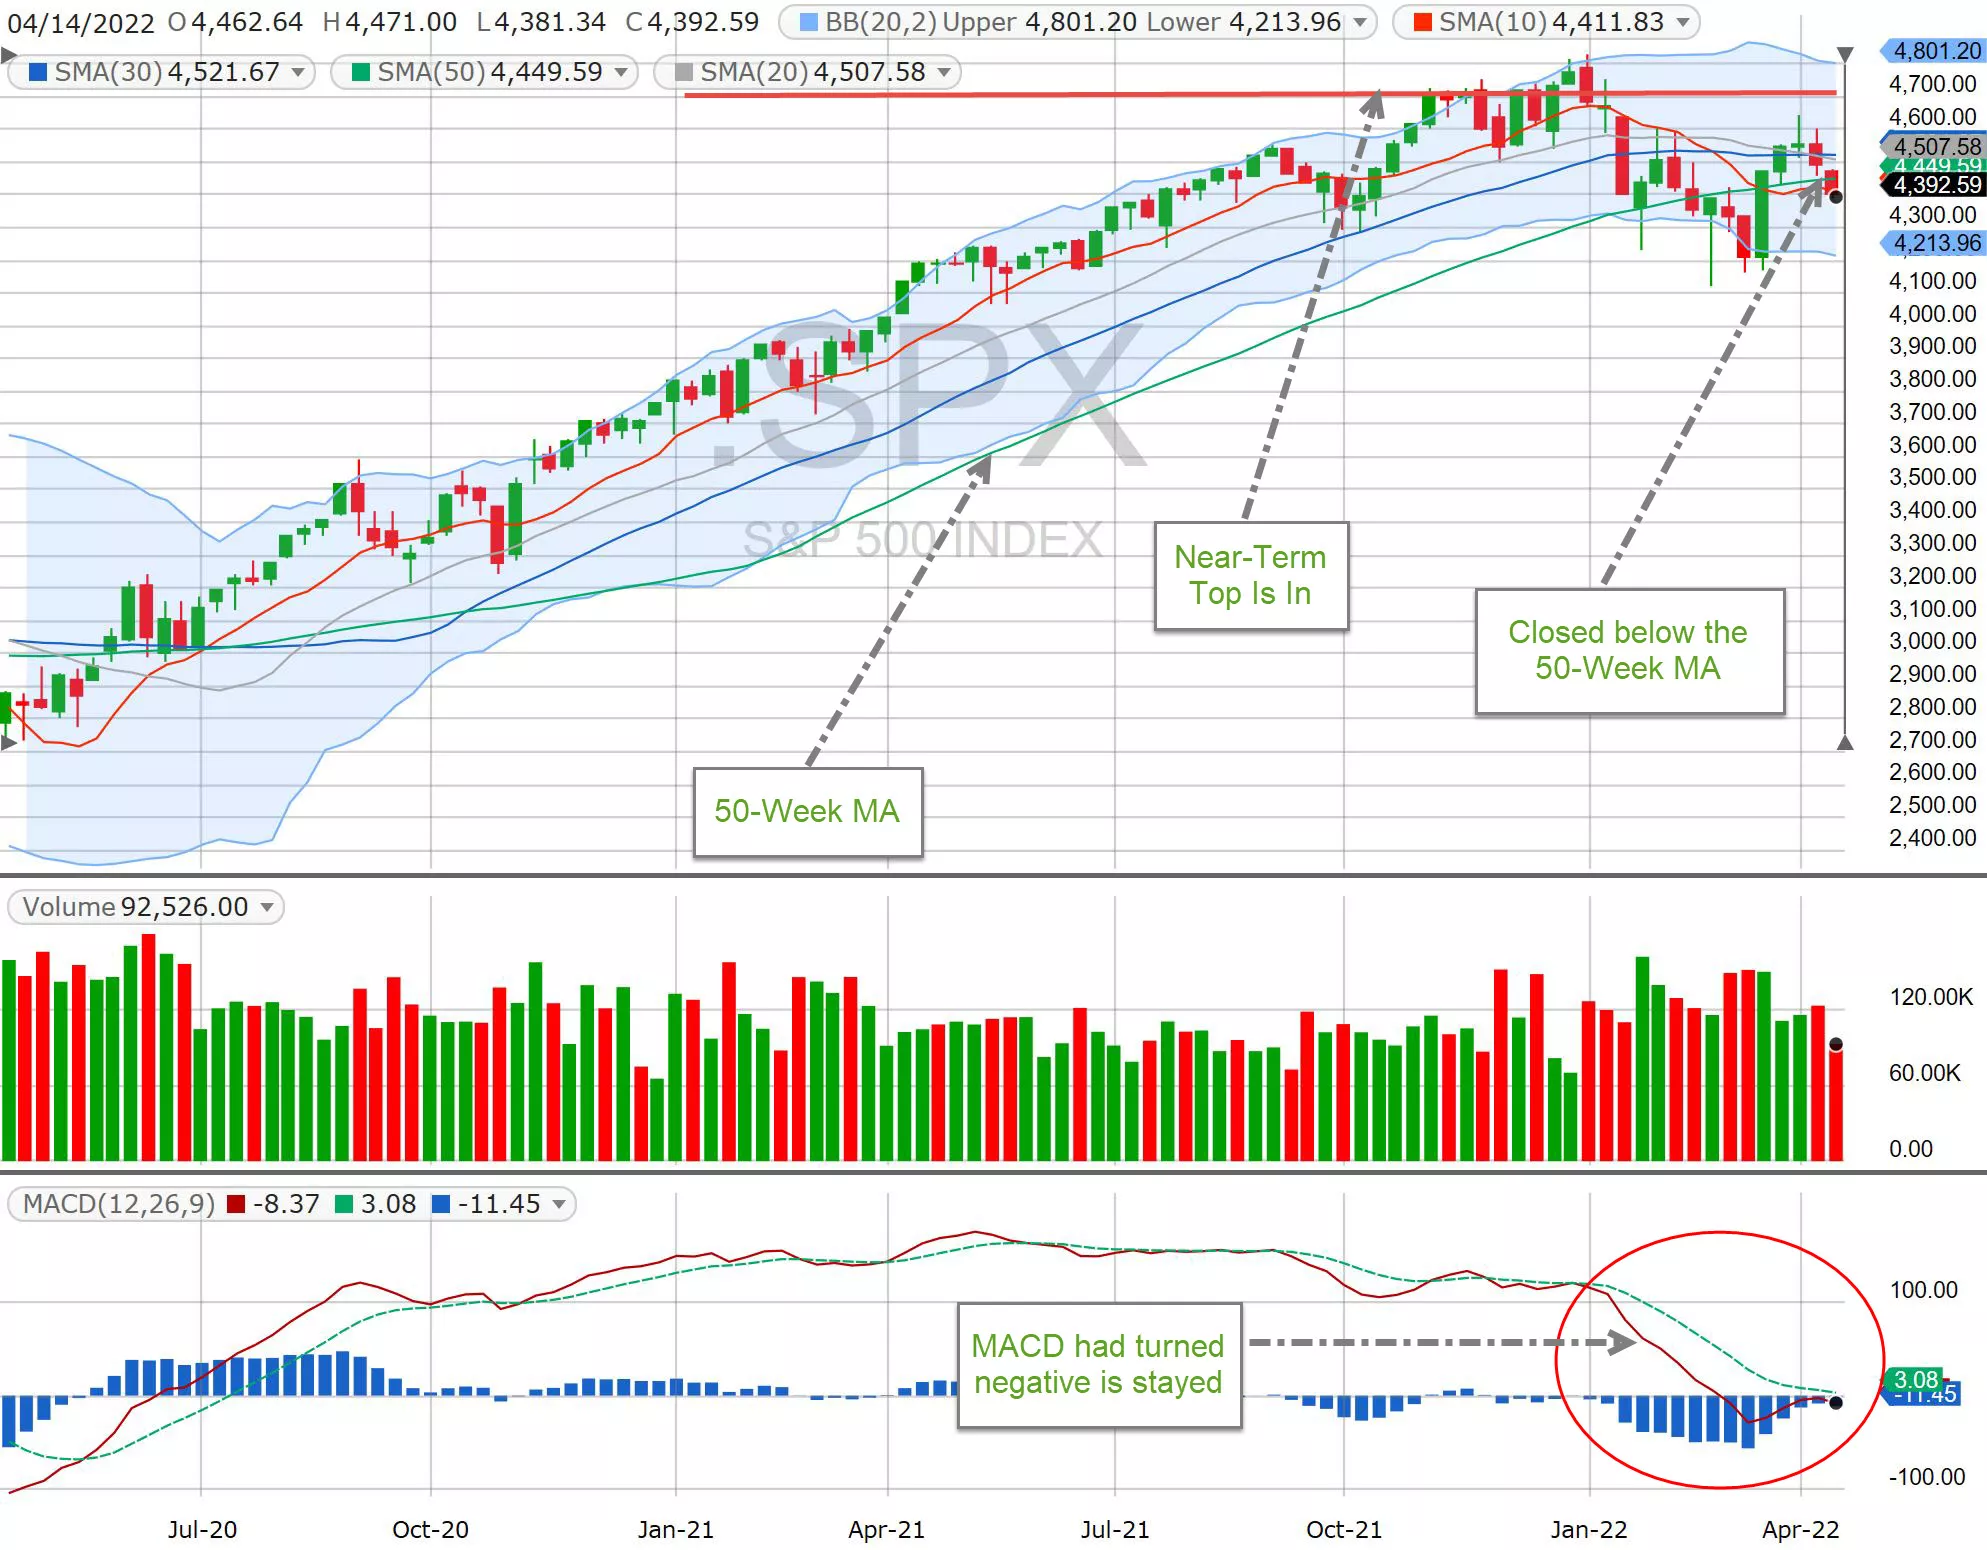
On the SPX weekly chart, we can see that the SPX has been falling since the beginning of this year. In March, we had a bounce and the index tested its 50-Week MA, and then, its 30-Week MA. However, it couldn't stay above for long. Last Friday, SPX closed below its 50-Week MA again. Its MACD has turned negative and it is staying negative for now.
Nasdaq
(Click on image to enlarge)
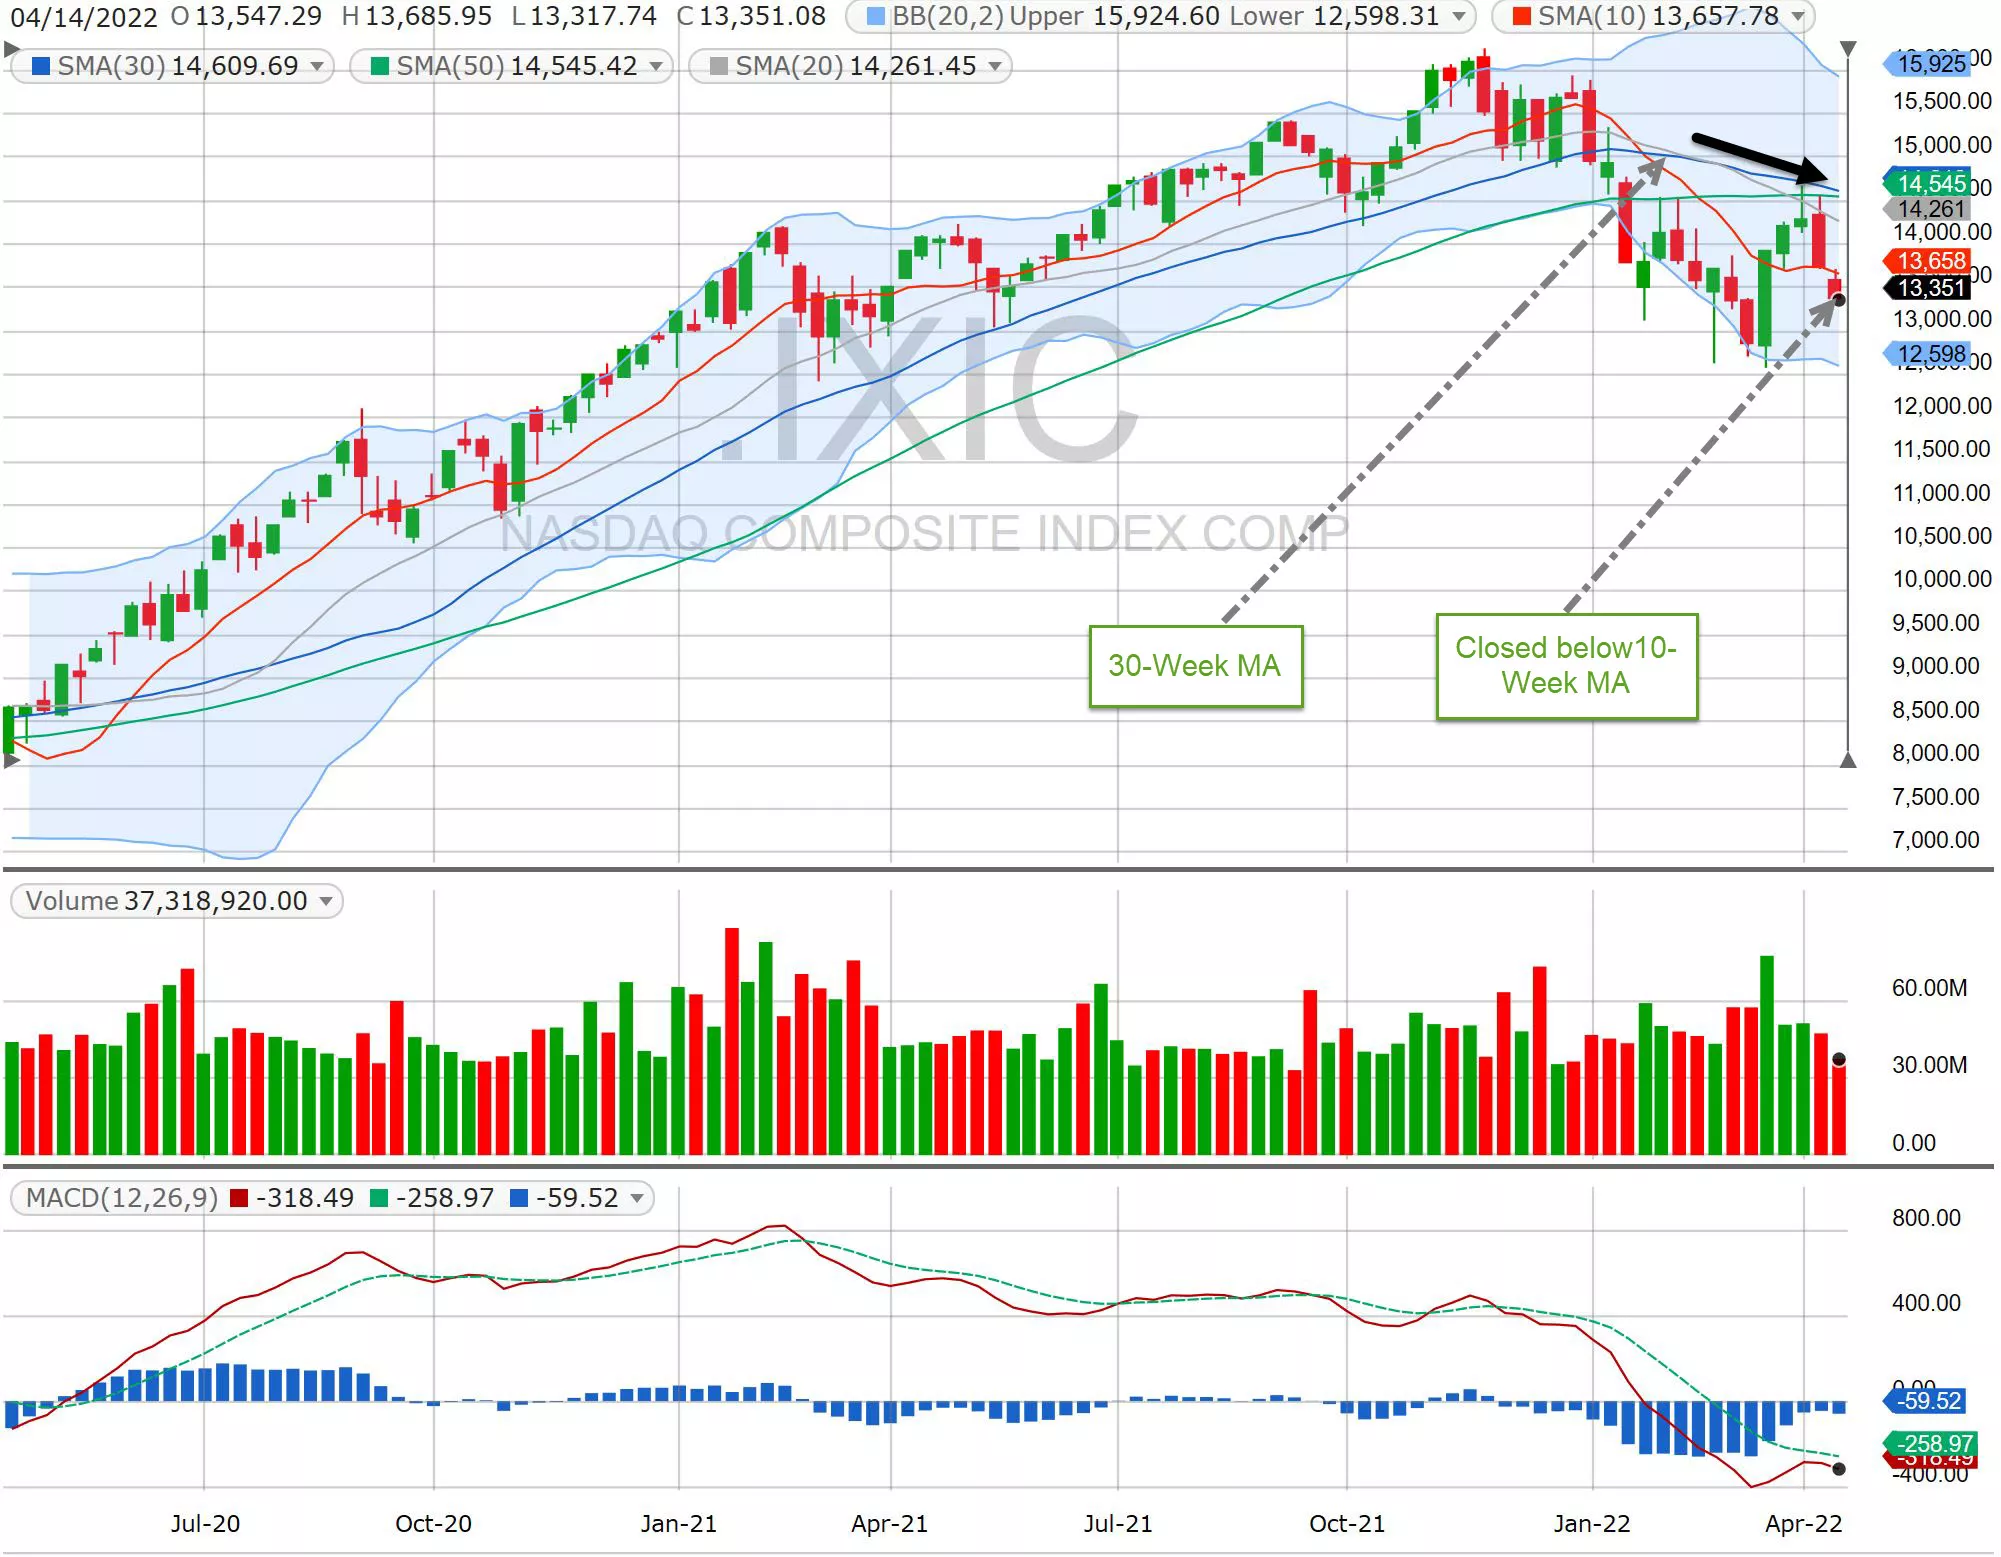
Nasdaq is fairing worse than the SPX, as higher interest rates seem to affect high-tech stocks more. Nasdaq shared not only all of SPX's developments, its 30-Week MA has turned downward.
RUT
(Click on image to enlarge)
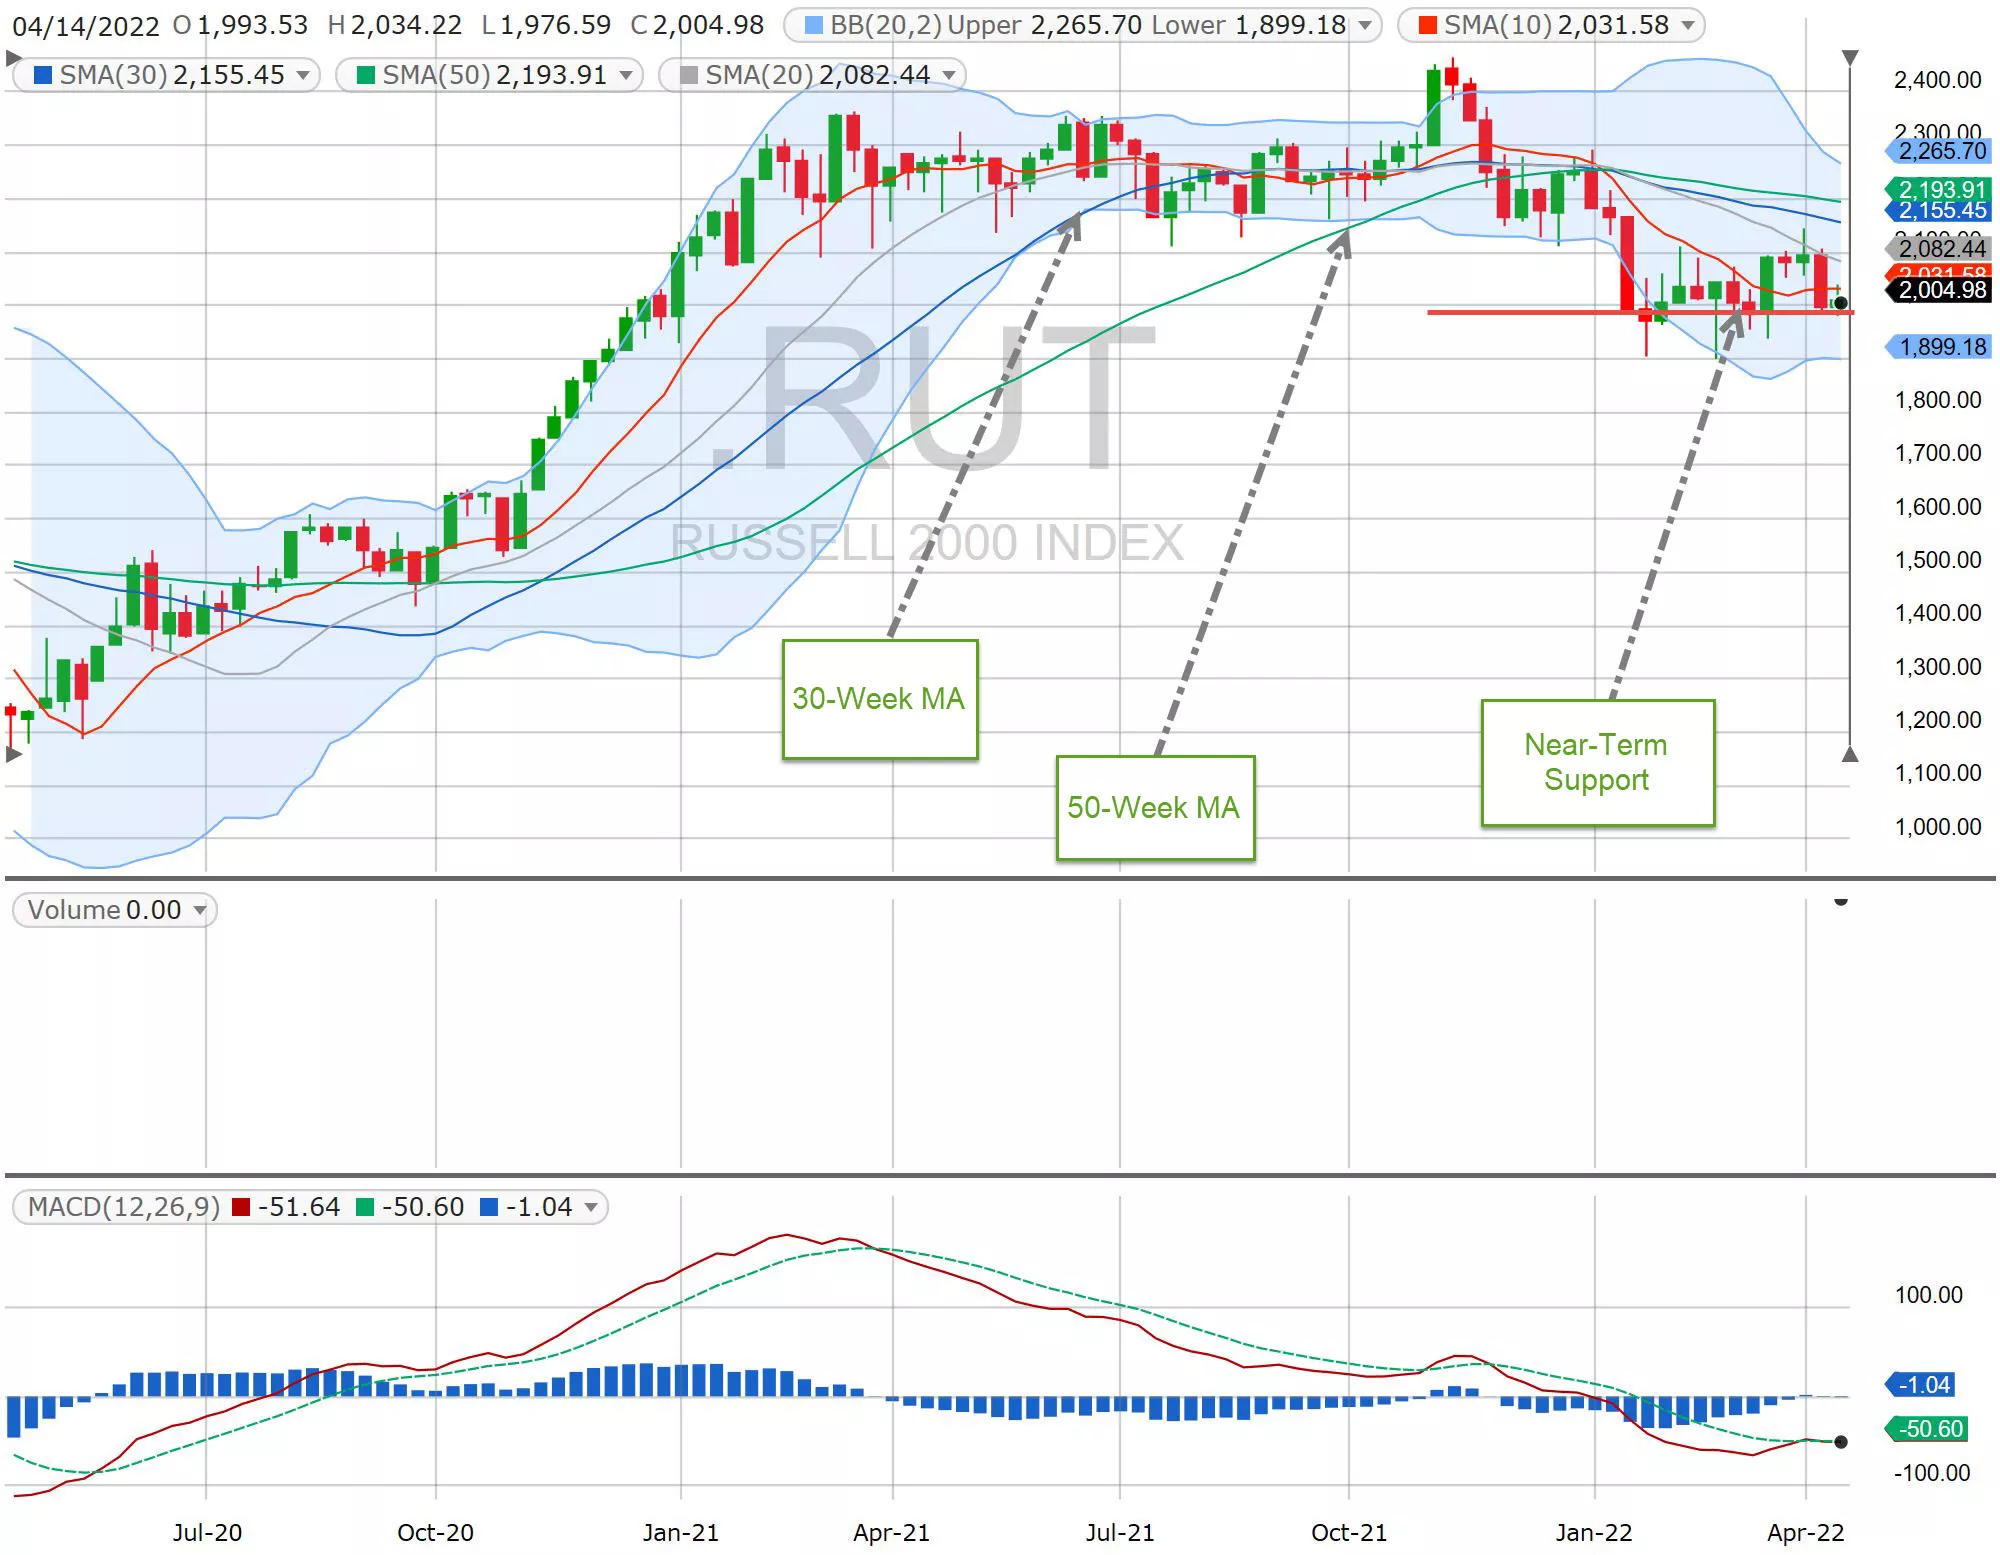
Both of RUT's 30-Week and 50-Week MAs have turned down and it barely closed above the recent support last week.
All three indices fell lower in January and bounced in March. But, they were unable to hold the recovery and are looking to fall lower still. Looking back, we haven't seen market indices take this kind of "double-dipping" since October 2015! Even with the drastic pullback in 2020 when COVID-19 first broke out, the markets quickly bounced back and resumed their ascending paths.
So, with the fundamentals and technicals stacked against the markets, are stocks ready for a bigger correction? It sure looks like the path of least resistance from here is - down!
Good morning and HappyTrading!
Continue Reading Part 2: The Path Of Least Resistance, Part II - A Crash Is Coming
Disclosure: Please remember that past performance may not be indicative of future results. Different types of investments involve varying degrees of risk, and there can be no ...
more

