

Image Source: Pexels
In this brief market report, we will take a look at the various asset classes, sectors, equity categories, ETFs, and stocks that moved the market higher, as well as the market segments that defied the trend by moving lower over the past week. The idea is to discern newly emerging market leadership.
Identifying these pockets of strength and weakness can often allow us to see the direction of significant money flows, along with their origin.
May was the Best Month of the Last 12
The old saying, "sell in May and go away" did not seem to work this year. Had you sold on May 1, you would have forfeited a 6.2% gain for the month.

Image Source: ZenInvestor
A Look at Monthly Returns
This next chart shows the monthly returns for the past year. The chart brings into focus the powerful rally we saw in May. Investors were cheered on by solid economic numbers, a slight downtick in inflation, and the prospect of a big tax cut.

Image Source: ZenInvestor
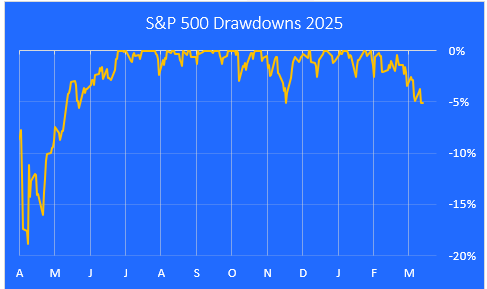
A Look at Drawdowns This Year
Here is a closer look at the pullbacks we've experienced over the last 12 months, using a drawdown chart. The current drawdown is -3.8% from the Feb. 19 high. As you can see, most of the damage done in the February-March period (down 19%) has been repaired in the April-May timeframe.

Image Source: ZenInvestor
A Look at the Bull Run Since it Began Last October
The following chart highlights the 60% gain in the S&P 500 from the October 2022 low through last Friday's close. We are still below the long-term trendline, and it looks to me like we may have a few more bouts of selling before this correction is over.

Image Source: ZenInvestor
Major Asset Class Performance
Here is a look at the performance of the major asset classes, sorted by last week's returns. The best performer was the US REIT space, and the worst performance was seen in commodities.

Image Source: ZenInvestor
Major Indices Performance
Last week, the Magnificent 7 led the market higher, bringing the Nasdaq and large-caps along with them. Meanwhile, emerging markets gave back some of their recent gains.

Image Source: ZenInvestor
Non-US Market Returns
This chart shows last week's returns for non-US markets. They have been leading the US so far this year, but they couldn't keep up last week. Europe and Japan have been doing well, while China has continued to struggle.

Image Source: ZenInvestor
Equity Sector Performance
Real estate (REITs) had a great week, as did most of the market sectors. Only energy failed to show a weekly gain.

Image Source: ZenInvestor
Equity Factor Performance
This next chart shows the weekly performance of equity factors like quality, value, low volatility, and so on. We can see that companies with high scores for profitability and consistency of earnings growth (a.k.a. quality) were in demand last week.

Image Source: ZenInvestor
Growth vs. Value
With the Magnificent 7 leading the way higher last week, growth outperformed value.

Image Source: ZenInvestor
Commodities
It was not a good week to be exposed to commodities. Gold gave back a small amount of its strong gains, and gasoline took a beating.

Image Source: ZenInvestor
The S&P Mag 7
Here is a closer look at the Magnificent 7. These 7 stocks are still down on a year-to-date basis. Faith in the AI trade is being tested, but last week we got positive earnings news for Nvidia (NVDA). It passed that test with flying colors.
But the big winner this week was Meta Platforms (META), followed by Apple (AAPL).

Image Source: ZenInvestor
The Mag 7's Dominance is a Drag On Performance This Year
After leading the market higher for the last two years, the Magnificent 7 are now a drag on the S&P 500 index on a year-to-date basis. The other 493 stocks in the S&P 500 are up an average of 0.9% year-to-date.
Investors are cutting back on the Magnificent 7 stocks and looking for other potential AI winners that are trading at much better prices.

Image Source: ZenInvestor
The 10 Best-Performing ETFs from Last Week
The big winners last week were Global Jets (JETS) and Leisure & Entertainment (PEJ). The wealthy class has money to burn, and it looks like they spent some of it last week.

Image Source: ZenInvestor
The 10 Worst-Performing ETFs from Last Week
After making the top 10 list for two weeks in a row, Cannabis (MSOS) is back on the loser list, down 5.7% last week alone. The AdvisorShares Pure US Cannabis ETF has recently been trading at $2.41 per share. I'm going out on a limb and saying that could be a good entry point for investors who can tolerate lots of volatility.

Image Source: ZenInvestor
Momentum Stocks
National Vision Holdings (EYE) has rocketed higher this year, but it's still way below its high water mark set in 2021. Investors want bargains right now, and Hertz (HTZ) looks like it could be a good value play.

Image Source: ZenInvestor
Final Thoughts
It was a good week, which capped off a very strong month. Can the market rise another 4% from here to make a new record high? Eventually it will, but there is still a larger than usual amount of uncertainty out there regarding tariffs, trade deals, and the tax bill. Trump and Xi are still fighting over tariffs, and things could go south there, which would probably delay our reaching the new high on the S&P 500.
To recap the week's action, investors were doing the following:
- Selling commodities and buying REITs
- Selling emerging market stocks and buying US stocks
- Selling Chinese names and buying European names
- Selling value stocks and buying growth stocks
- Selling energy stocks and buying tech and healthcare names
- Selling cannabis stocks and buying leisure & entertainment names
More By This Author:
The One-Minute Market Report - Sunday, May 11The One-Minute Market Report - Saturday, April 26
The One-Minute Market Report - Saturday, April 19

Comments
Log in or sign up to join the conversation.