

Image Source: Pexels
In this brief market report, we will take a look at the various asset classes, sectors, equity categories, ETFs, and stocks that moved the market higher, as well as the market segments that defied the trend by moving lower. Identifying these pockets of strength and weakness can often allow us to see the direction of significant money flows, along with their origin.
The Market Is Having a Tariff Tantrum
As tariffs - real or threatened - ratcheted up, and weakness in consumer spending, employment, and earnings estimates took hold, investors pulled back from equities and sought safety in cash, gold, and Treasury bonds. The market was down 3.1% for the week and down 2.9% year-to-date. We are now back to where we started on election day in November 2024.

Image Source: ZenInvestor.org
A Look at Monthly Returns
This next chart illustrates the monthly returns for the past year. After a weak showing in February, March has been off to an even weaker start.

Image Source: ZenInvestor.org
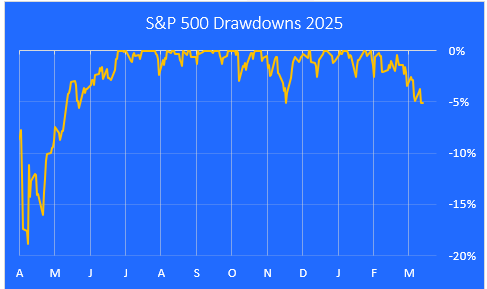
A Look at Drawdowns This Year
Here is a closer look at the pullbacks we've had over the last 12 months, using a drawdown chart. The current drawdown is -6.1%, following the new high made on Feb. 19. I think we're due for a 10% correction sometime this year.

Image Source: ZenInvestor.org
A Look at the Bull Run Since it Began Last October
This next chart highlights the 61.3% gain in the S&P 500 from the October 2022 low through last Friday's close. It appears to be well below the trendline, and it seems that there may be further to go on the downside before this pullback is over.

Image Source: ZenInvestor.org
Major Asset Class Performance
Here is a look at the performance of the major asset classes, sorted by last week's returns. I also included the returns since the Oct. 12, 2022 low for additional context.
The best-performing asset class last week was Volatility, which should surprise no one. The worst performer was the small-cap Russell 2000 index. It looks like China and Europe are still doing well.

Image Source: ZenInvestor.org
Equity Sector Performance
For this report, I use the expanded sectors as published by Zacks. They use 16 sectors rather than the standard 11. This gives us added granularity as we survey the winners and losers.
Investors were buying defensive sectors like healthcare and consumer staples, while selling financials and consumer discretionary stocks.

Image Source: ZenInvestor.org
Equity Group Performance
For the groups, I separate the stocks in the S&P 1500 Composite Index by shared characteristics like growth, value, size, cyclical, defensive, and domestic vs. foreign.
The best-performing groups last week were non-US stocks, both developed and emerging. Investors raised cash by selling the Magnificent 7 group and other growth stocks..

Image Source: ZenInvestor.org
The S&P Mag 7
Here is a look at the 7 mega-cap stocks that have been leading the market over the past two years. These stocks are off to a weak start year-to-date. Faith in the AI trade is being tested. Participation in the bull market has broadened on a year-to-date basis. Tesla (TSLA) was hit the hardest, with Nvidia (NVDA) not far behind.

Image Source: ZenInvestor.org
The Mag 7's Dominance is a Drag on Performance
After leading the market higher for the last two years, the Magnificent 7 are now a drag on the S&P 500 index on a year-to-date basis. The other 493 stocks in the S&P 500 are up an average of 4.0% year-to-date.

Image Source: ZenInvestor.org
The 10 Best-Performing ETFs from Last Week
The two biggest winners this week, Eurozone Equity (EZU) and Europe Financials (EUFN), demonstrate how market leadership is changing in 2025.

Image Source: ZenInvestor.org
The 10 Worst-Performing ETFs from Last Week
Leisure & Entertainment (PEJ) was one of the best market segments last year, and now it has become a source of funds. Regional Banks (KRE) sold off hard, as did Brokers-Exchanges (IAI).

Image Source: ZenInvestor.org
Best-Performing Stocks
Middlesex Water (MSEX), a regulated utility, got a boost from an increase in the rates it charges to residential and industrial customers in New Jersey, Pennsylvania, and Delaware.

Image Source: ZenInvestor.org
Worst-Performing Stocks
Sleep Number (SNBR) beat their earnings numbers, but they fell short on revenue. Analysts have been trimming forecasts as a result.

Image Source: ZenInvestor.org
Final Thoughts
To recap, in the week just past, investors were doing the following:
- Selling stocks, and buying bonds and gold
- Selling small-caps, and raising cash
- Selling leisure & entertainment, and buying consumer staples
- Selling growth stocks, and buying value stocks
- Selling US stocks, and buying foreign stocks
- Selling the Magnificent 7, and buying other large-caps
More By This Author:
The One-Minute Market Report - Saturday, March 1The One-Minute Market Report - Saturday, Feb. 22
The One-Minute Market Report - Sunday, Nov. 2

Comments
Log in or sign up to join the conversation.