The Andromeda Strain Paradox
The Andromeda Strain Paradox
Michael Crichton's 1969 thriller The Andromeda Strain, about an extraterrestrial plague arriving in New Mexico on a crashed satellite, contains an apparent paradox (to avoid a minor spoiler relating to this 51-year-old novel, skip to the next paragraph). There are only two survivors from the small town where the satellite crashed, and they have nothing in common: a 69-year-old man addicted to Sterno (the cans of methanol used to fuel the fires under chafing dishes), and a healthy infant. A series of medical tests conducted on both yields no immediate answers: the 69-year-old's blood is acidic (pH <7) and the infant's blood is in the normal range (7.39-7.43). Eventually, the apparent paradox is resolved: the baby had been constantly crying after the satellite crashed, causing its blood to become alkalotic. The Andromeda Strain only thrives within the normal pH range.
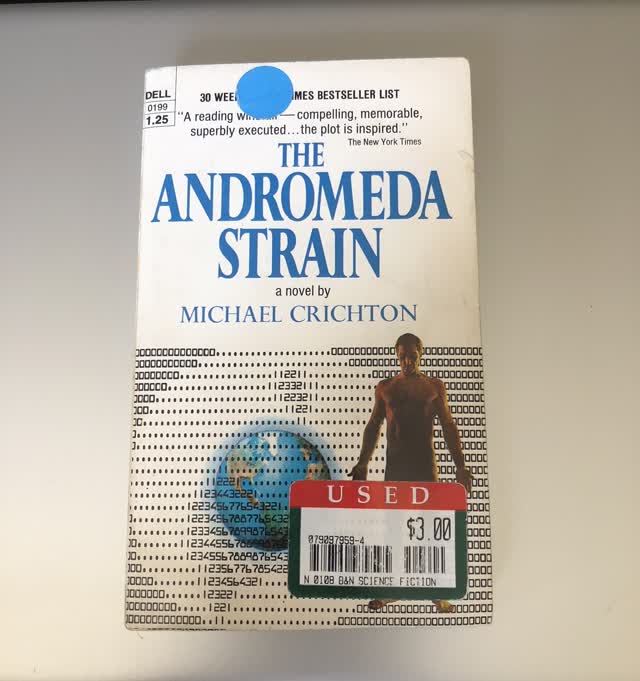
The author's used copy of The Andromeda Strain.
Another Apparent Paradox
What brought the The Andromeda Strain to mind recently (other than the obvious, COVID-19) is an apparent paradox we've seen in security returns on Portfolio Armor's two different daily rankings: one ("top names") very inexpensive to hedge with puts, the other ("cash substitutes") very expensive to hedge with puts, but both posting strong returns.
Top Names
The first daily ranking, the "top names" list, consists of ten securities that are, on average, inexpensive to hedge with put options. For example, the average cost of hedging Tuesday's top names against a >20% decline over the next six months with optimal, or least expensive, puts was 1.91% of position value. By way of comparison, the cost of hedging the SPDR S&P 500 ETF (SPY) the same way was 4.03%.
So far, we have full 6-month performance data for 127 weekly top names cohorts, and they've outperformed SPY on average, as you can see below (interactive charts of all the top names cohorts so far are available here).
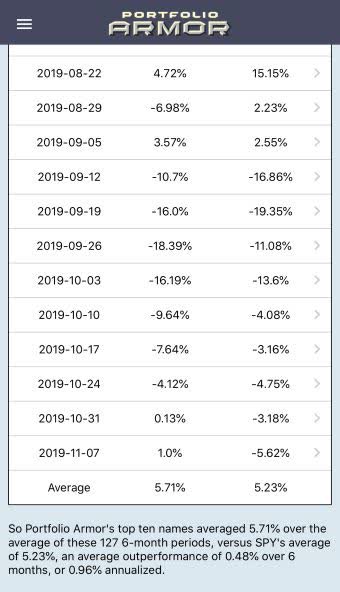
Portfolio Armor uses those top names as a starting point for the primary securities it includes in hedged portfolios.
Cash Substitutes
To minimize hedging costs in hedged portfolios, our website rounds down dollar amounts of primary securities to round lots (numbers divisible by 100). At the end of that process, there's cash leftover from the rounding down process. Since every position is hedged in our hedged portfolios, cash isn't necessary for liquidity or to limit risk. So, since returns on cash are low, we seek to minimize cash. The way we do that is by replacing as much of it as possible with what we call a "cash substitute". That's a security that when tightly collared (with an upside cap set at 1%, or the current 7-day yield on the Fidelity Cash Reserves Money Market Fund, whichever is higher) has a higher expected return than cash, and a maximum drawdown within your indicated risk tolerance.
To facilitate this, we have a daily ranking of cash substitutes. These are inexpensive to hedge when tightly collared, but tend to be extremely expensive to hedge with puts. For example, on the same day our top names had an average put hedging cost of 1.91% of position value, the average put hedging cost for the cash substitutes list was 13.23%.
Low Risk Versus High Risk
If you think of put hedging cost as a proxy for downside risk, you'd probably expect wildly different returns from these two rankings. And at the individual level, we've seen that. The cash substitutes typically have a broader range of individual performance than the top names. For an extreme example, let's look at the cohorts that hit their 6-month mark near the March market bottom.
First, the top names cohort from 9/26/2019:
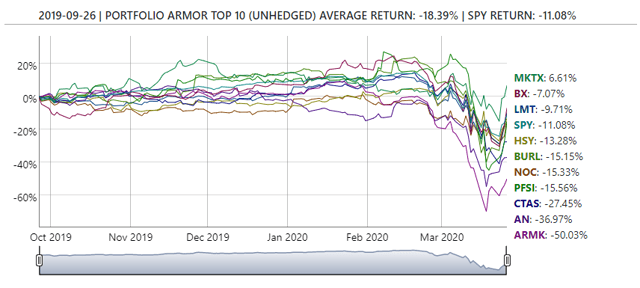
The best performer there was MarketAxess (MKTX), up 6.61%, and the worst performer was Aramark (ARMK), down 50.03%.
Now, the cash substitutes from 9/26/2019:
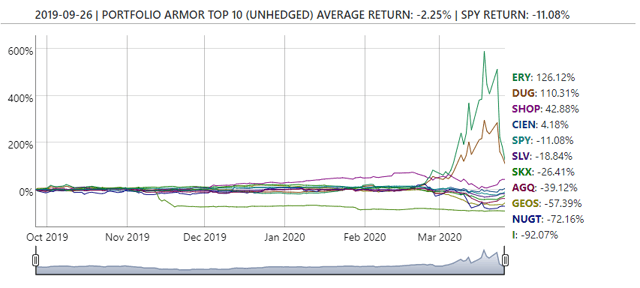
The best performer there was the Direxion Daily Energy Bear 3X Shares ETF (ERY), up 126.12%, and the worst performer was Intelstat (I) down 92.07%.
More Recent Performance
I mentioned in a previous post that Portfolio Armor's top names started shifting away from stocks on March 2nd. Here's the performance of the March 2nd top names cohort so far.
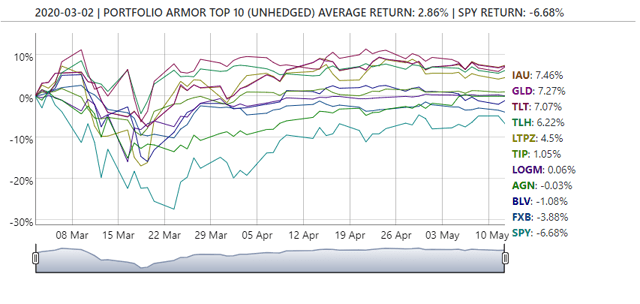
Best name, the iShares Gold Trust ETF (IAU) up 7.46%; worst name, the Invesco Currency Shares British Pound Sterling Trust (FXB) down 3.88%.
Now here's the performance of the March 2nd cash substitute cohort so far:
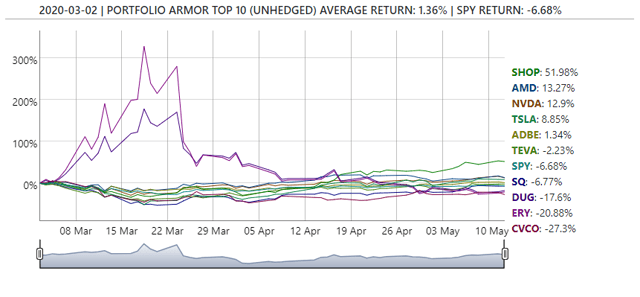
The best name, Shopify (SHOP) up 51.98%; the worst name Cavco (CVCO) down 27.3%.
And yet both the top names and the cash substitutes from March 2nd have outperformed SPY so far, despite the top names being mostly non-equity ETFs (fixed income, gold, currency) and the cash substitutes being mostly stocks, plus a couple of leveraged bearish energy ETFs.
The Bottom Line
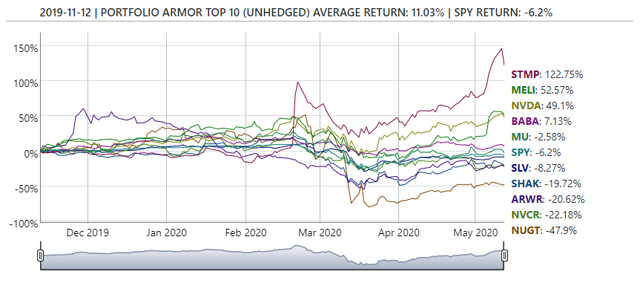
We've only been tracking the unhedged returns of the cash substitutes since the end of August, and so far they've been fairly even with the top names performance since then overall. But the most recent cash substitute cohorts to hit the 6-month mark have been beating the market handily, such as the November 12th one:
How We're Using This Data
We're using the performance of the cash substitutes to adjust how we select our top names. All else equal, if cash substitutes have an x% performance advantage, on average, they will get an x% boost on the top names ranking (if they have a performance disadvantage going forward, we'll take that into account too). In other words, if the cash substitutes substantially outperform, we'll see more of them on the top names ranking as well.
How You Can Use This Now
We don't currently post the cash substitute rankings publicly, but if you're curious if a stock or ETF is on the ranking, you can get an idea of that by scanning for an optimal collar on it against a >9% drop over the next six months, using an upside cap of 1%. The average hedging cost of cash substitutes collared that way is now about -5%. If you see a similar result, there's a good chance your stock or ETF is on the ranking.


