
Tech Stocks Struggling At Double Top Fibonacci Resistance

Image Source: Unsplash
Technology stocks have been the engine behind the stock market rally into 2024. Even better stated, tech stocks have been a market leader since 2009.
So it’s important to keep an eye on the performance of market leadership. And lately, the tech-based Nasdaq indices have been slowing down.
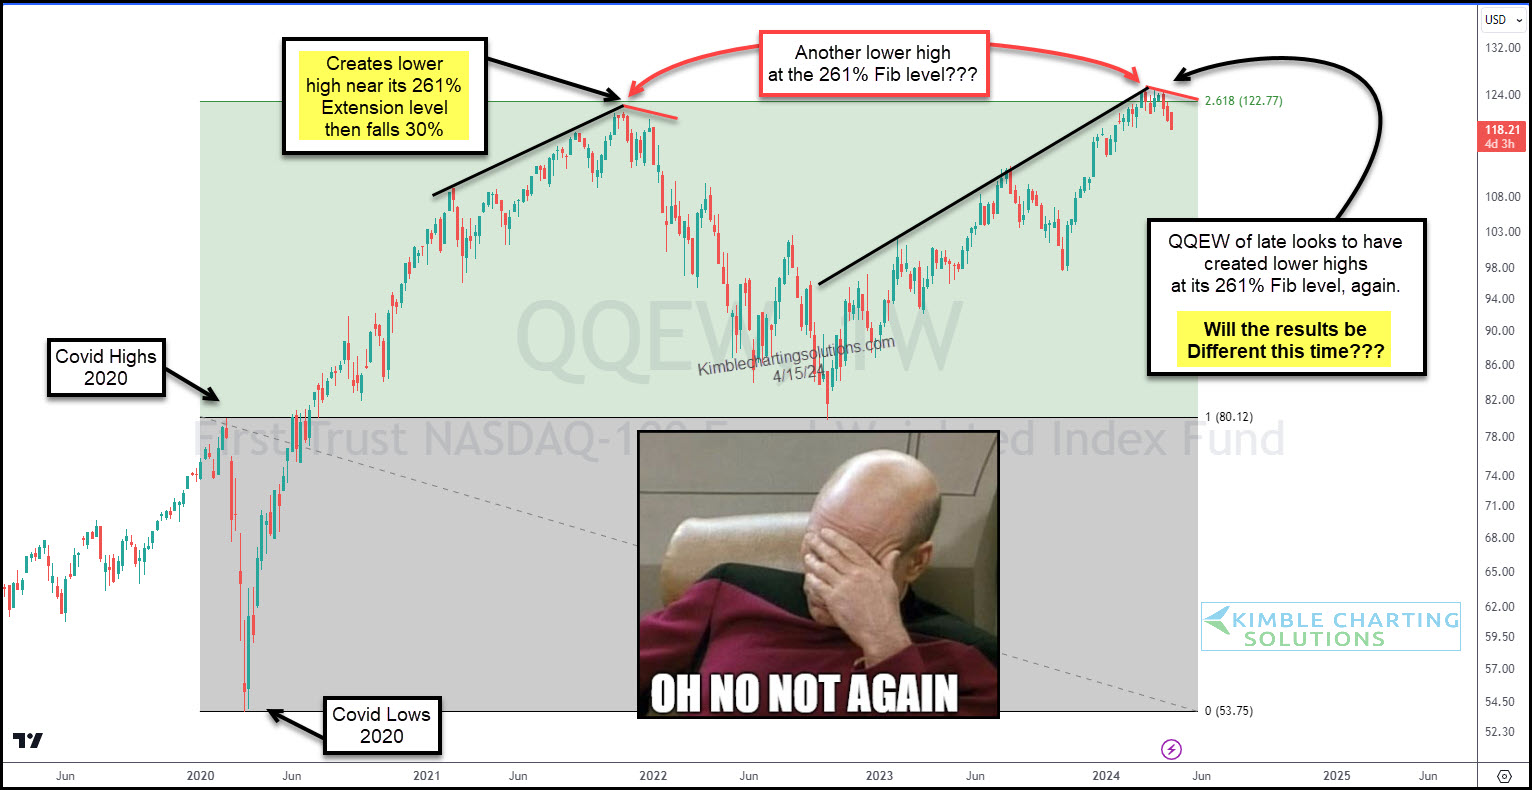
Today, we highlight this with one of my favorite ways to interpret market strength: equal-weight indices & ETFs. The chart below is the Nasdaq 100 Equal Weight ETF (QQEW) on a “weekly” basis.
As you can see, price has stalled out yet again at the 261% Fibonacci extension level. And in a very similar way.
How long with this double-top Fibonacci resistance hold for? Will it be long enough to send QQEW much lower? Or will it be different this time?
Keep an eye on this level.
(Click on image to enlarge)
More By This Author:
Will Gold’s 12-Year Cycle Send It Much Higher?
Gold/US Dollar Attempting Historic Bullish Breakout, Says Joe Friday
Is The S&P 500 Flashing A Spring Sell Signal?
Disclosure: Sign up for Chris's Kimble Charting Solutions' email alerts--click here.


