
T2108 Update – Embracing The Chop
(T2108 measures the percentage of stocks trading above their respective 40-day moving averages [DMAs]. It helps to identify extremes in market sentiment that are likely to reverse. To learn more about it, see my T2108 Resource Page. You can follow real-time T2108 commentary on twitter using the #T2108 hashtag. T2108-related trades and other trades are occasionally posted on twitter using the #120trade hashtag. T2107 measures the percentage of stocks trading above their respective 200DMAs)
T2108 Status: 39.6%
T2107 Status: 47.5%
VIX Status: 13.8
General (Short-term) Trading Call: Neutral
Active T2108 periods: Day #168 over 20%, Day #127 above 30%, Day #3 over 40% (overperiod), Day #21 under 50% (underperiod), Day #38 under 60%, Day #237 under 70%
Reference Charts (click for view of last 6 months from Stockcharts.com):
S&P 500 or SPY
SDS (ProShares UltraShort S&P500)
U.S. Dollar Index (volatility index)
EEM (iShares MSCI Emerging Markets)
VIX (volatility index)
VXX (iPath S&P 500 VIX Short-Term Futures ETN)
EWG (iShares MSCI Germany Index Fund)
CAT (Caterpillar).
Commentary
Last week I decided to embrace the chop, and the results were pretty good. In the last T2108 Update, I reviewed the results of the previous week’s trades which took advantage of a bounce I anticipated based on T2108. I was wary about the coming Federal Reserve’s meeting and did not want to make any predictions for last week. However, when Monday (June 18th) delivered a down day, I sprung into action…
#forex market not (yet?) showing angst of stock market, so inclined to look for $SPY to bounce from short-term extended condition.
— Duru A (@DrDuru) Jun. 15 at 06:49 AM
$AAPL looks over-extended on a short-term basis. Below lower-Bollinger Band . Very rare for it. And hasn't spent long this far from 50DMA
— Dr. Duru (@DrDuru) June 15, 2015
The euro continues to act favorably to latest news on the Greek drama. Makes me even more convinced of a $SPY bounce today. $EURUSD
— Dr. Duru (@DrDuru) June 15, 2015
Sure enough, the S&P 500 (SPY) bounced off its lows which happened to poke through the lower - Bollinger Band (BB). The bounce continued for three straight days until Friday’s pullback toward the 50DMA. The end result was almost typical chop action as the index closed at the highs of the previous week.
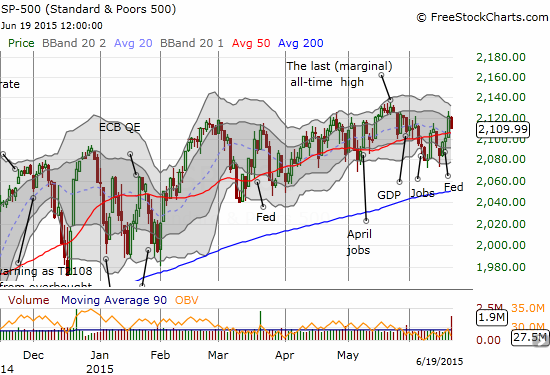
Yet more chop for the S&P 500. Note how the range has tightened since March
There were several keys to my belief that the good risk/reward trade was to go long even ahead of knowing what the Fed would do to calm the market’s nerves. I noted the surprisingly complacent response in the forex market to the latest round of Greek drama: the European Central Bank (ECB) even warned that it did not know whether Greek banks would have money in a week! There was also the volatility index, the VIX, which had once again bumped right into the pivot point…and stopped cold.
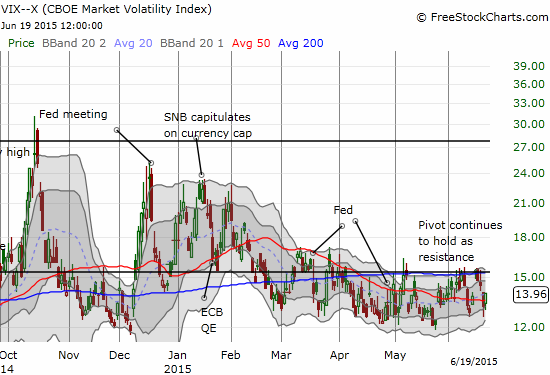
The volatility index has been unable to gain any momentum as the 15.35 pivot continues to hold as tough resistance
Finally, there is of course my favorite technical indicator, T2108. T2108 plunged back to the recent lows on Monday, so all I had to do was bet that it would bounce from that support. As a reminder, the neighborhood of 30% has consistently proven itself as “close enough” to oversold in this market. T2108 dropped as low as 31.2%. It got as high as 50.7% on Thursday.That is quite a range! And that range provided a lot of room for bullish trades.
As readers may recall, I have my eyes trained on Netflix (NFLX) and Amazon.com (AMZN) for swing trades.Those stocks were automatic selections on Monday for call options. I went after Apple (AAPL) which has the additional feature of pivoting around its 50DMA. I was also very aggressive in executing on my trading strategy for United States Oil Fund LP (USO). The USO trades required both call and put options as USO swung away from and back to its 50DMA. My successes in all these trades appear to validate my approaches. I also went to the well again on call options for ProShares Ultra S&P500 (SSO) and was even able to salvage most of the value of the previous week’s SSO call options. The only trade I missed that I should have made was on iShares MSCI Emerging Markets ETF (EEM). This was partially a function of already having call options left over from previous hedged trades. My last set of puts closed out successfully in the previous week. EEM did not reach a “natural” point of resistance, so I did not reload on put options.
{I will update this post later tonight with relevant charts – or I might create a supplementary post. This will include charts of SHAK, BOX, ORCL, and IBB}
Daily T2108 vs the S&P 500

Black line: T2108 (measured on the right); Green line: S&P 500 (for comparative purposes)
Red line: T2108 Overbought (70%); Blue line: T2108 Oversold (20%)
Weekly T2108

*All charts created using freestockcharts.com unless otherwise stated
Disclosure: Long SHAK, ...
more

