
SPDR Select Sector Fund ETF Elliott Wave Technical Analysis
SPDR Select Sector Fund ETF – XLF
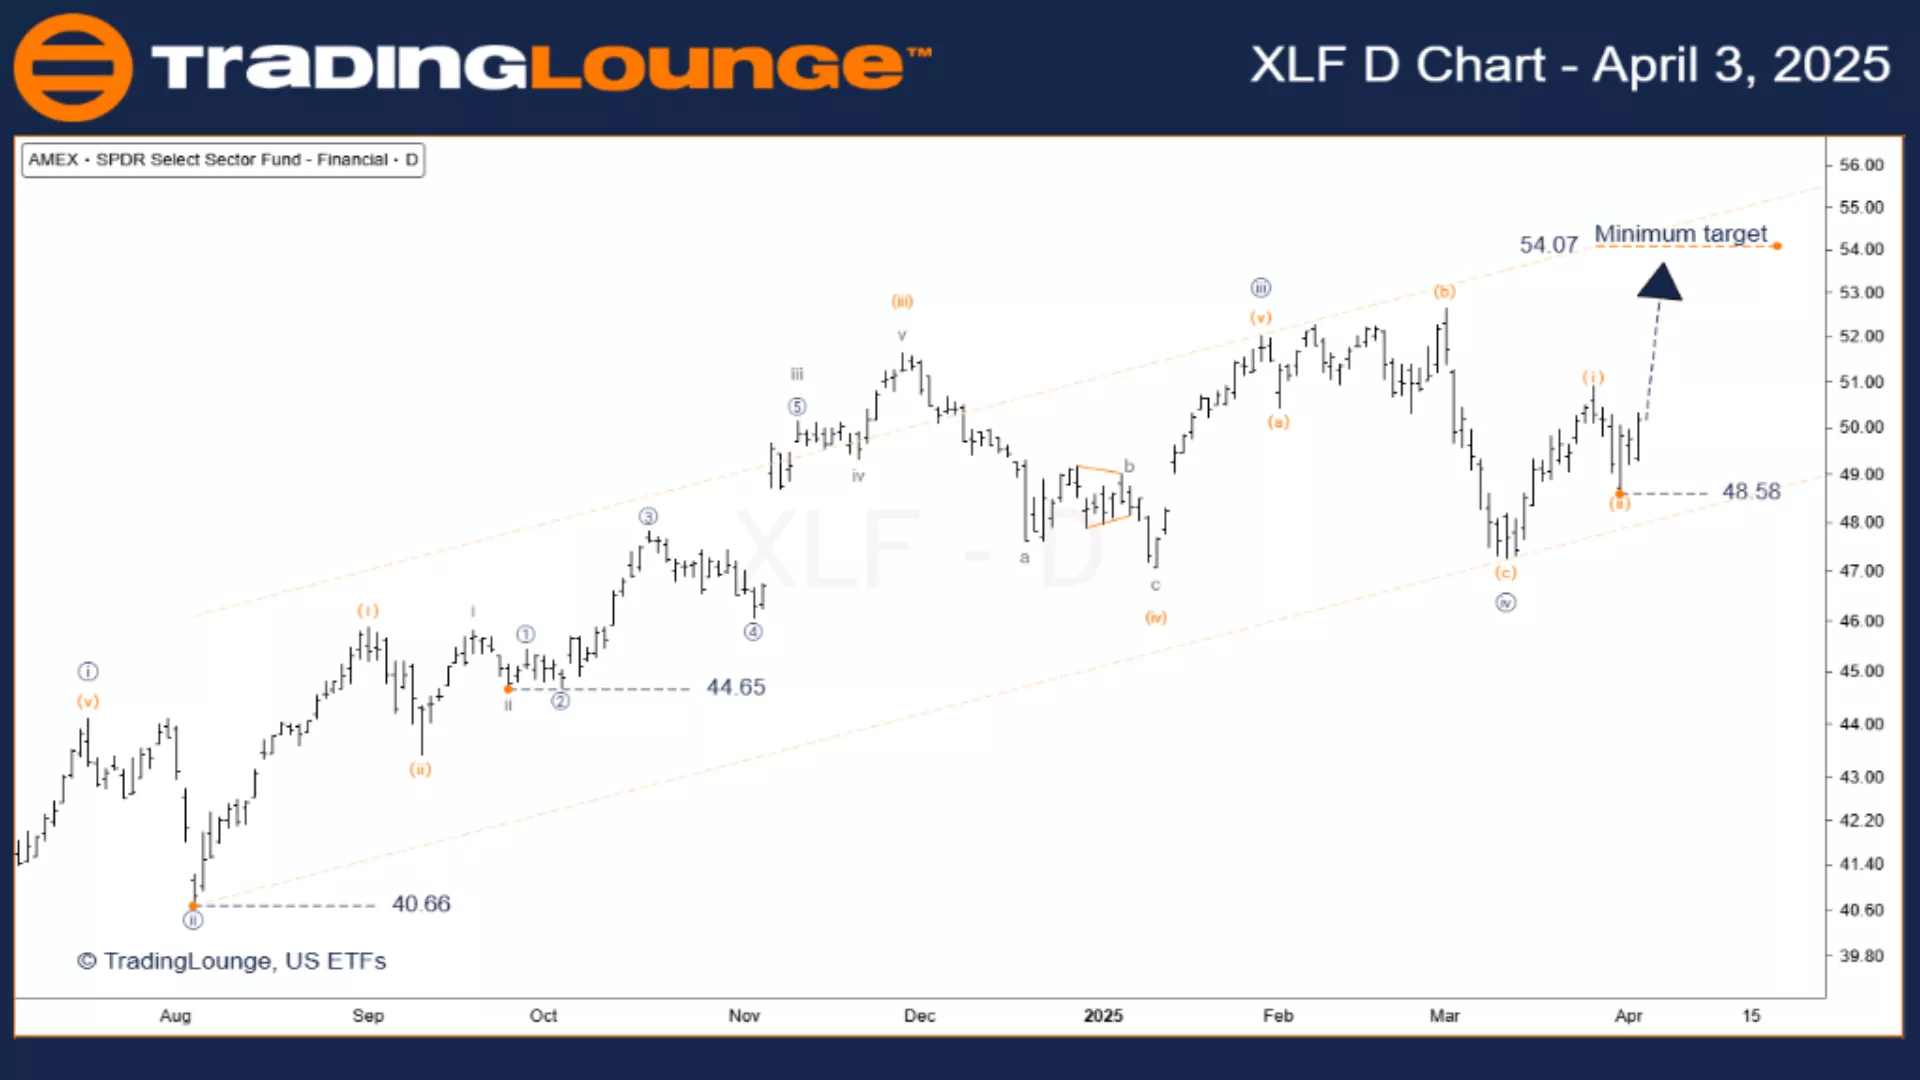
(1D) Elliott Wave Technical Analysis – Daily Chart
Function: Major Trend
Mode: Motive
Structure: Impulse Wave
Position: Wave [v] navy
Direction: Uptrend
Daily Chart Insights
- The fifth wave is currently active, with a minimum target of $54.07.
- We are in wave (iii) of [v], the most powerful phase of the impulse.
- This rally is expected to break above the wave [iii] high.
- Invalidation Level: $48.58 – breaching this level challenges the wave structure.
SPDR Select Sector Fund ETF – XLF
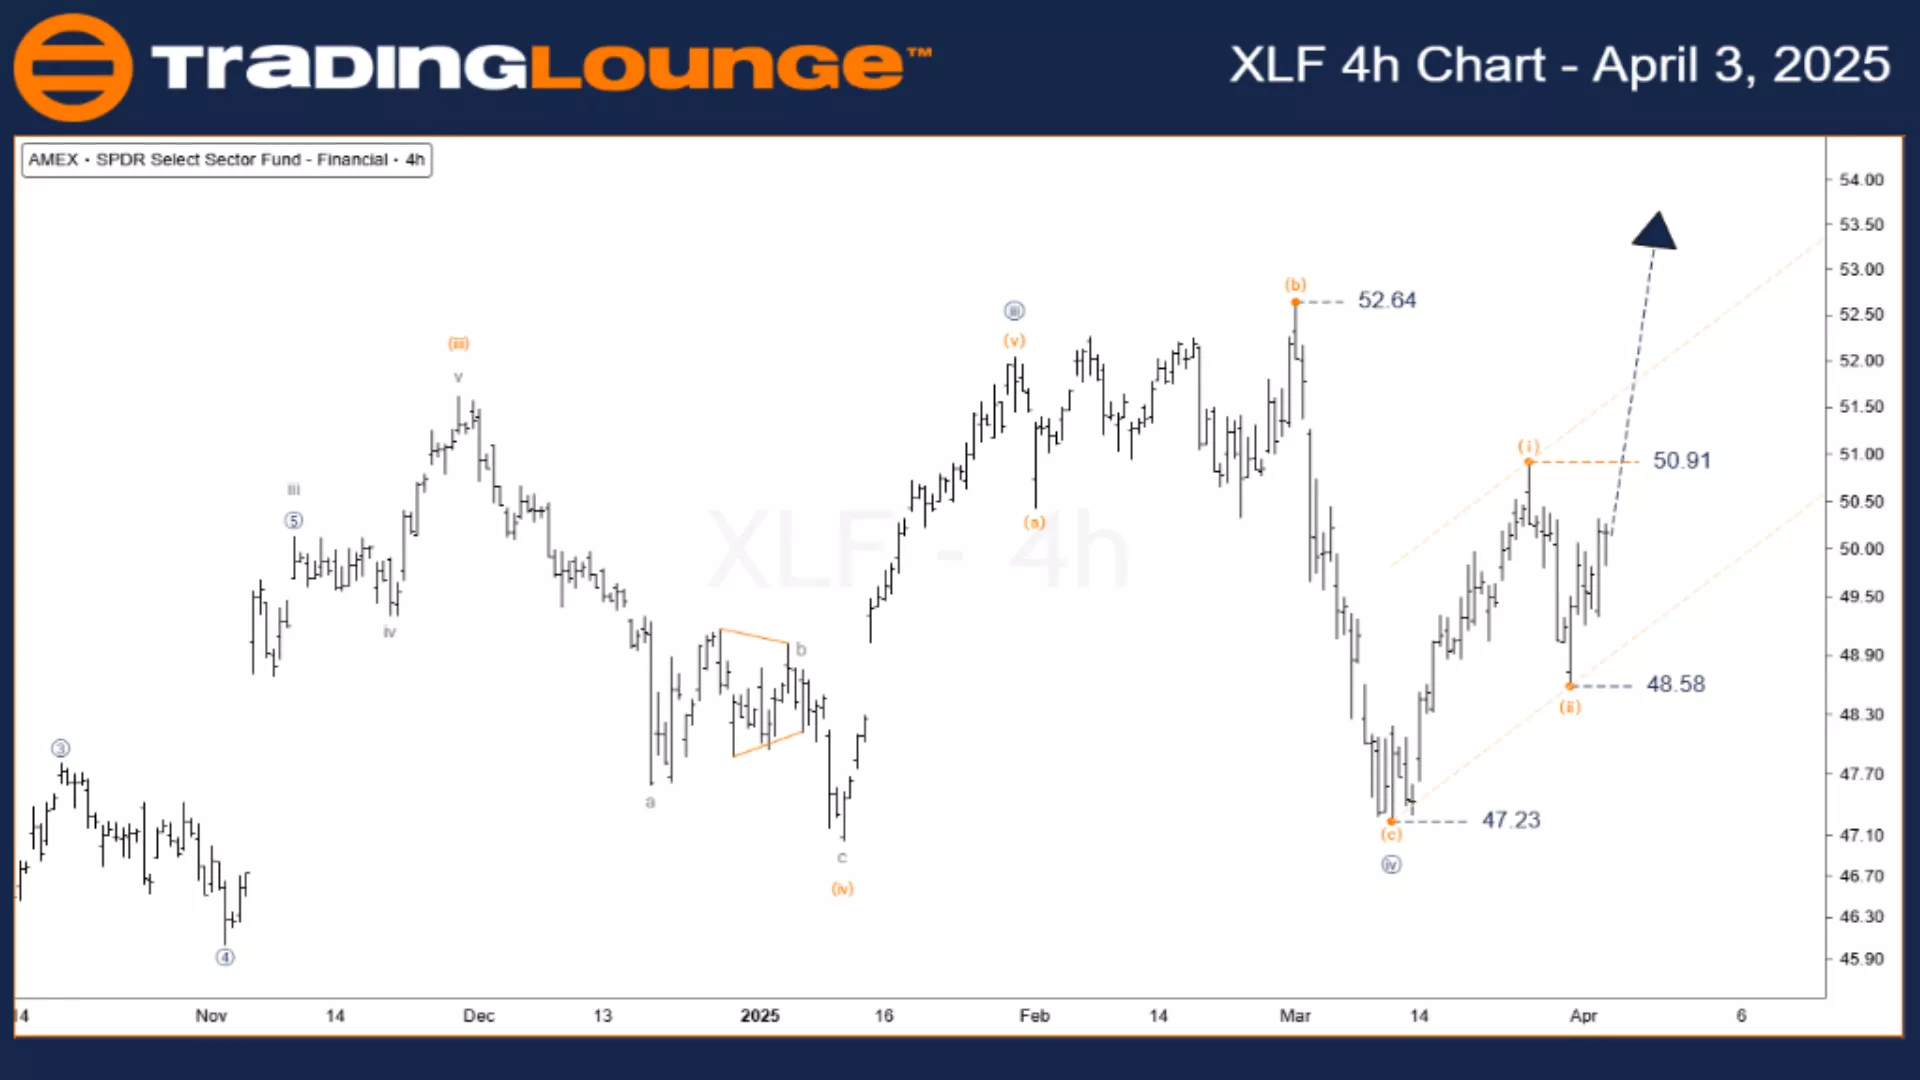
(4H) Elliott Wave Technical Analysis – 4-Hour Chart
Function: Major Trend
Mode: Motive
Structure: Impulse
Position: Wave (iii) orange
Direction: Uptrend
4-Hour Chart Insights
- Wave (ii) ended at $48.58, reducing the probability of a complex correction – a bullish sign.
- The current move marks the early stages of wave (iii), a prime setup for buyers.
- Anytime now is a potential buying opportunity.
- Key confirmation level: $50.91 – ideal for conservative entries.
- Critical support: $49.50
- Invalidation Level: $48.58 – must hold to maintain bullish outlook.
Conclusion
- The ongoing XLF rally aligns with a fifth wave impulse.
- The setup offers a strong long opportunity for ETF-focused traders.
- The rally is projected to exceed the previous wave [iii] high, aiming for a minimum of $54.07.
- Maintaining strict adherence to Elliott Wave principles and monitoring invalidation levels is essential to reduce risk.
Technical Analyst: Siinom
More By This Author:
Elliott Wave Technical Analysis: U.S. Dollar/Japanese Yen - Thursday, April 3
Elliott Wave Technical Review: Cardano Crypto Price News For Thursday, April 3
Technical Analysis, S&P 500, Nasdaq 100, DAX 40, FTSE 100, ASX 200
At TradingLounge™, we provide actionable Elliott Wave analysis across over 200 markets. Access live chat rooms, advanced AI & algorithmic charting tools, and curated trade ...
more

