

Image Source: Upsplash
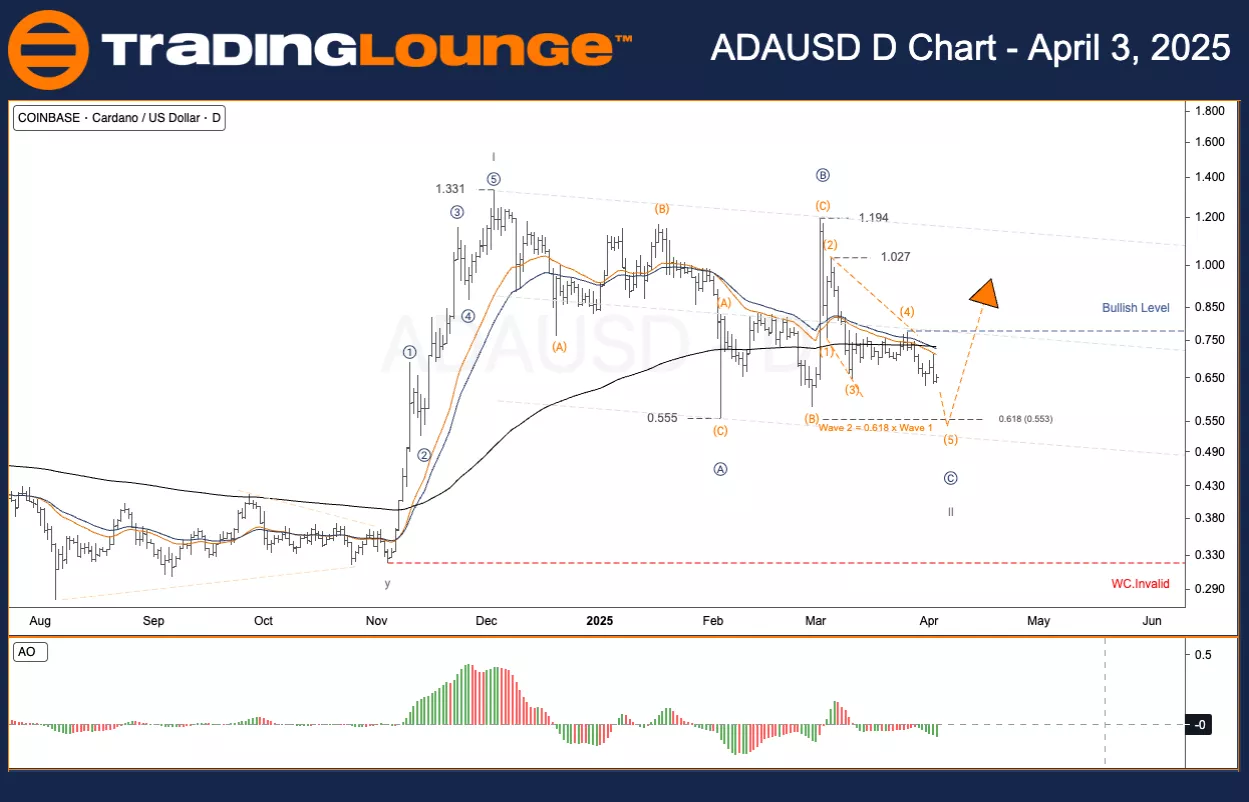
Elliott Wave Analysis - TradingLounge Daily Chart
ADA / U.S. Dollar (ADAUSD)
ADAUSD Elliott Wave Technical Review
-
Function: Counter Trend
-
Mode: Corrective
-
Structure: Flat
-
Position: Wave ((C))
-
Next Higher Degree Direction: Wave II
-
Invalidation Level: Not defined
ADA / U.S. Dollar (ADAUSD) – Trading Plan
Cardano (ADA) is currently positioned in wave C of wave II, which marks the final stage of a broader corrective move. Wave I concluded at the 1.331 USD level. Wave II follows a typical ABC correction pattern and is approaching the completion of wave C. The expected target for wave (5) within wave C is around 0.553 USD.
Trading Strategy
-
Approach
-
Tactic
-
✅ Short-Term Traders (Swing Trading)
-
Monitor for a new wave formation. The 0.53–0.56 USD price range could present a favorable entry point if a strong reversal pattern appears, such as:
-
Bullish divergence
-
Pin bar
-
Breakout
-
-
-
-
-
Risk Management
-
The wave count becomes invalid if price drops below 0.292 USD. In such case, the entire wave structure needs re-evaluation.
-
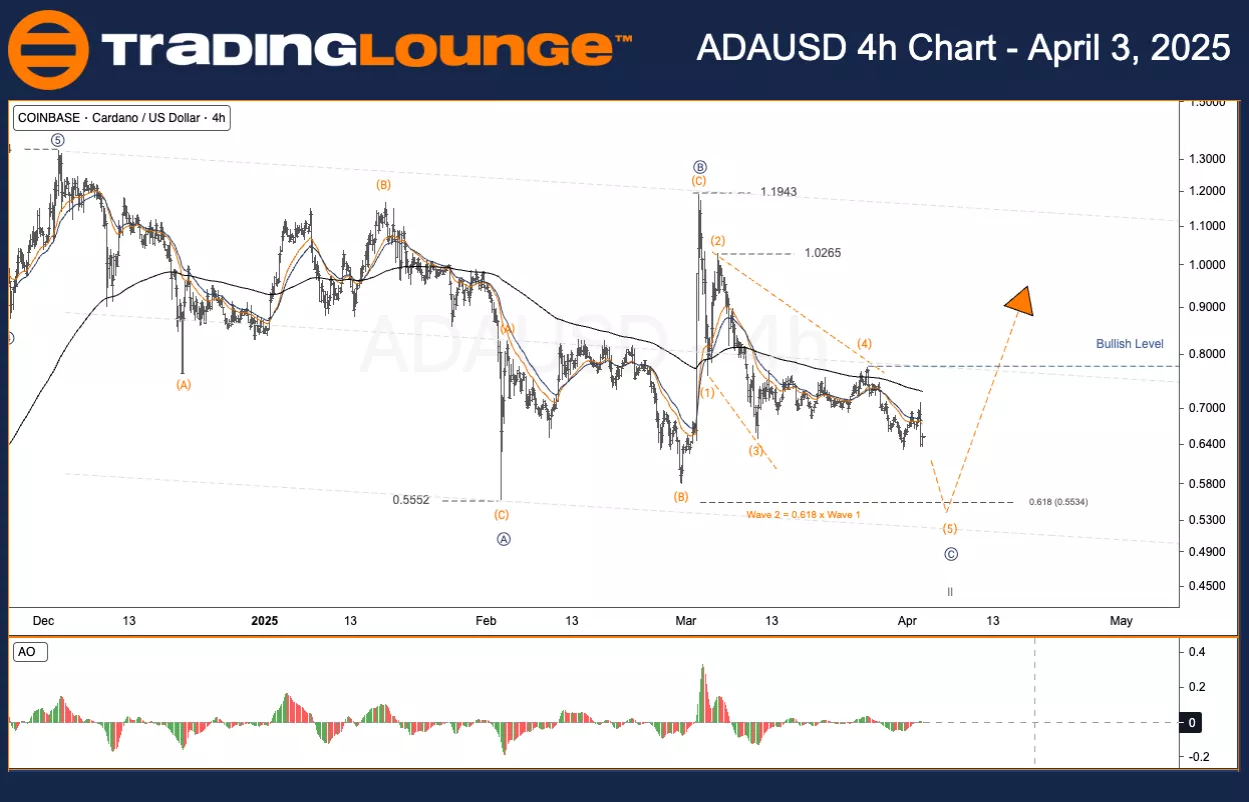
Elliott Wave Analysis - TradingLounge H4 Chart
ADA / U.S. Dollar (ADAUSD)
ADAUSD Elliott Wave Technical Review
-
Function: Counter Trend
-
Mode: Corrective
-
Structure: Flat
-
Position: Wave ((C))
-
Next Higher Degree Direction: Wave II
-
Invalidation Level: Not defined
ADA / U.S. Dollar (ADAUSD) – Trading Plan
On the H4 timeframe, Cardano (ADA) is likewise completing wave C of wave II – the last part of a major corrective cycle. Wave I peaked at 1.331 USD. The ABC correction within wave II is ending, with the final wave C targeting approximately 0.553 USD.
Trading Strategy
-
Approach
-
Tactic
-
✅ Short-Term Traders (Swing Trading)
-
Watch for a new impulsive wave. The 0.53–0.56 USD zone could be advantageous if clear reversal signs appear such as:
-
Bullish divergence
-
Pin bar
-
Breakout
-
-
-
-
-
Risk Management
-
The structure becomes invalid below the 0.292 USD level. If this happens, a full structural review is required.
-
Analyst: Kittiampon Somboonsod, CEWA
Source: TradingLounge.com
More By This Author:
Technical Analysis, S&P 500, Nasdaq 100, DAX 40, FTSE 100, ASX 200
VanEck Gold Miners ETF GDX – Elliott Wave Technical Analysis
Elliott Wave Analysis & Technical Forecast: National Australia Bank Limited


Comments
Log in or sign up to join the conversation.