

Image Source: Unsplash
It’s been a dreadful past couple of years for the Russell 2000 and small-cap stocks.
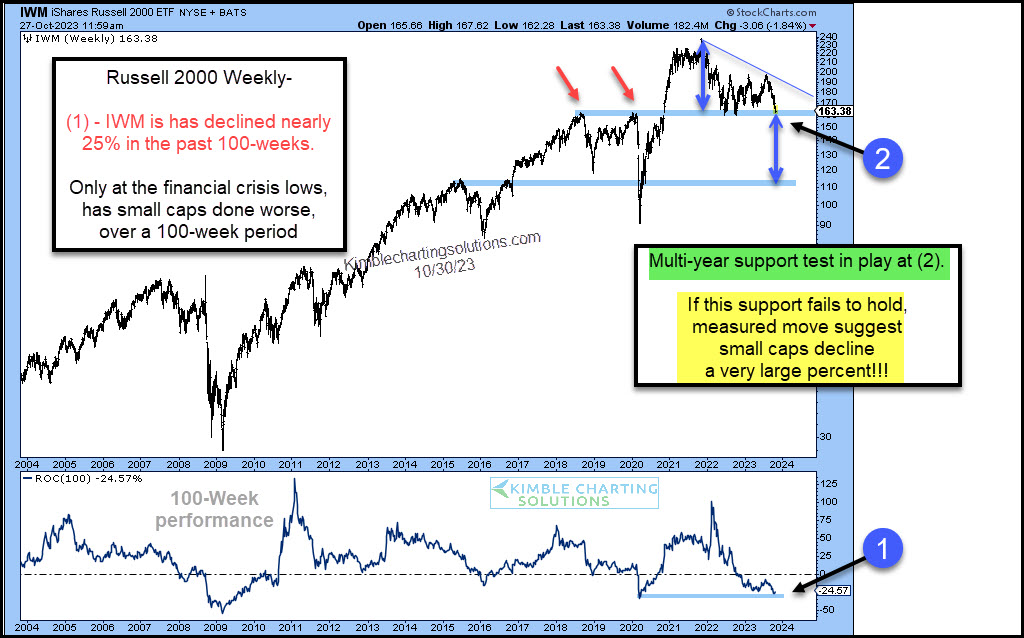
Only in 2009 have small caps performed worse over a 100-week period – point (1) on today’s chart.
Below we look at a long-term “weekly” chart to highlight some important technical developments that active investors should keep an eye on right here, right now.
After a rare 25% decline, the small-cap Russell 2000 ETF (IWM) is testing support at (2). We can see that this area was prior resistance (red arrows) so it holds even more significance.
Should this support fail to hold, the measured move suggests much more downside is possible. Yikes!
Seems to me that this is an important moment in time for small-cap stocks (and perhaps the broader stock market).
(Click on image to enlarge)
More By This Author:
Bank Stocks Testing Critically Important Price Support
S&P 500 Index Nears Important Long-Term Trend Support
Technology Stocks Testing Highely Influential Dual Support


Comments
Log in or sign up to join the conversation.