

Image Source: Pixabay
Stocks have come under pressure and concerns are beginning to mount.
But rather than zooming in on the short-term, sometimes it’s good to zoom out and look at the long-term technical picture. And in today’s case, it may very well lead us to the short-term outcome as well!
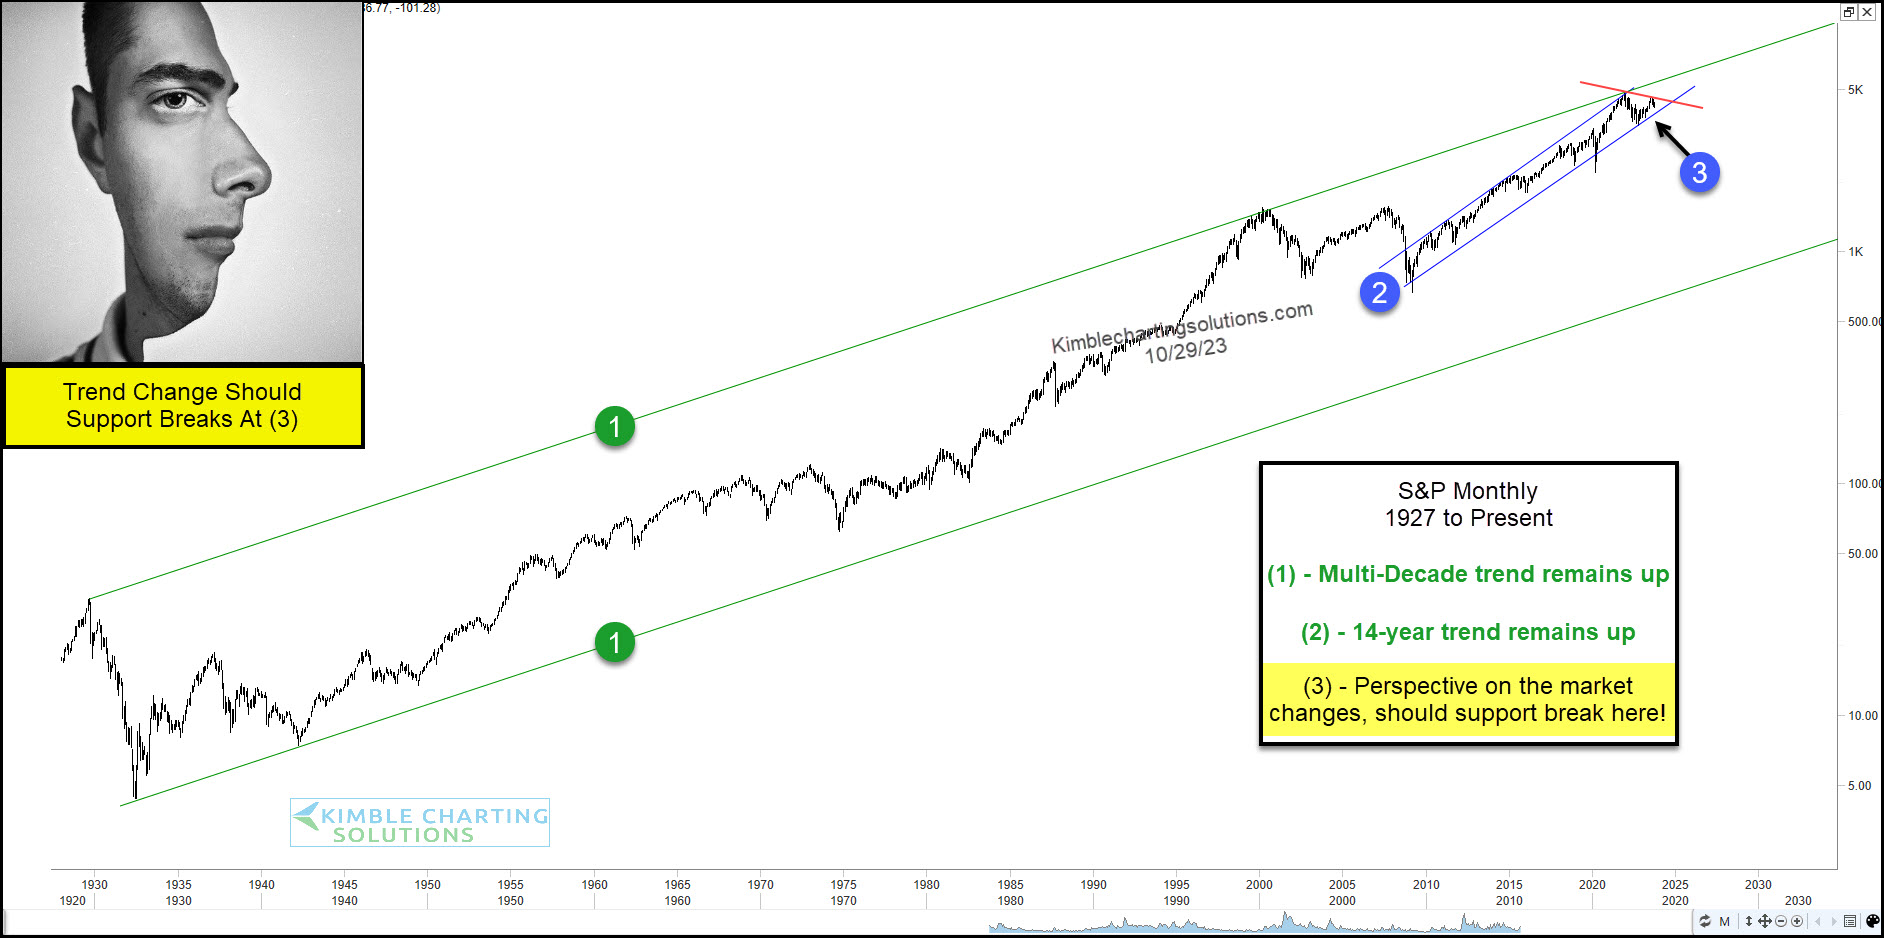
Below is a “monthly” chart of the S&P 500 Index.
As you can see, its multi-decade trend remains up at each (1). And it’s long-term trend remains up at each (2).
But this is where things get tricky. The peak in 2021 came at the long term trend channel resistance. We then turned down from there. We then saw a small bounce off the 14-year uptrend line marked by (2) before making a lower high. And now price is compressing at (3).
So while the trend remains higher for now, it is very important what happens in the coming weeks. Let’s just say that bulls need support to hold at (3).
(Click on image to enlarge)
More By This Author:
Technology Stocks Testing Highely Influential Dual Support
Is Major Stock Market Index Warning Trouble Ahead?
Gold Price Pattern Could Lead To Super Bullish Breakout


Comments
Log in or sign up to join the conversation.