Gold Price Pattern Could Lead To Super Bullish Breakout
The price of Gold has traded sideways for the past three years. Feels boring (and the pullbacks painful) for bulls.
But all this boring action could be coming to an end… with a bang!
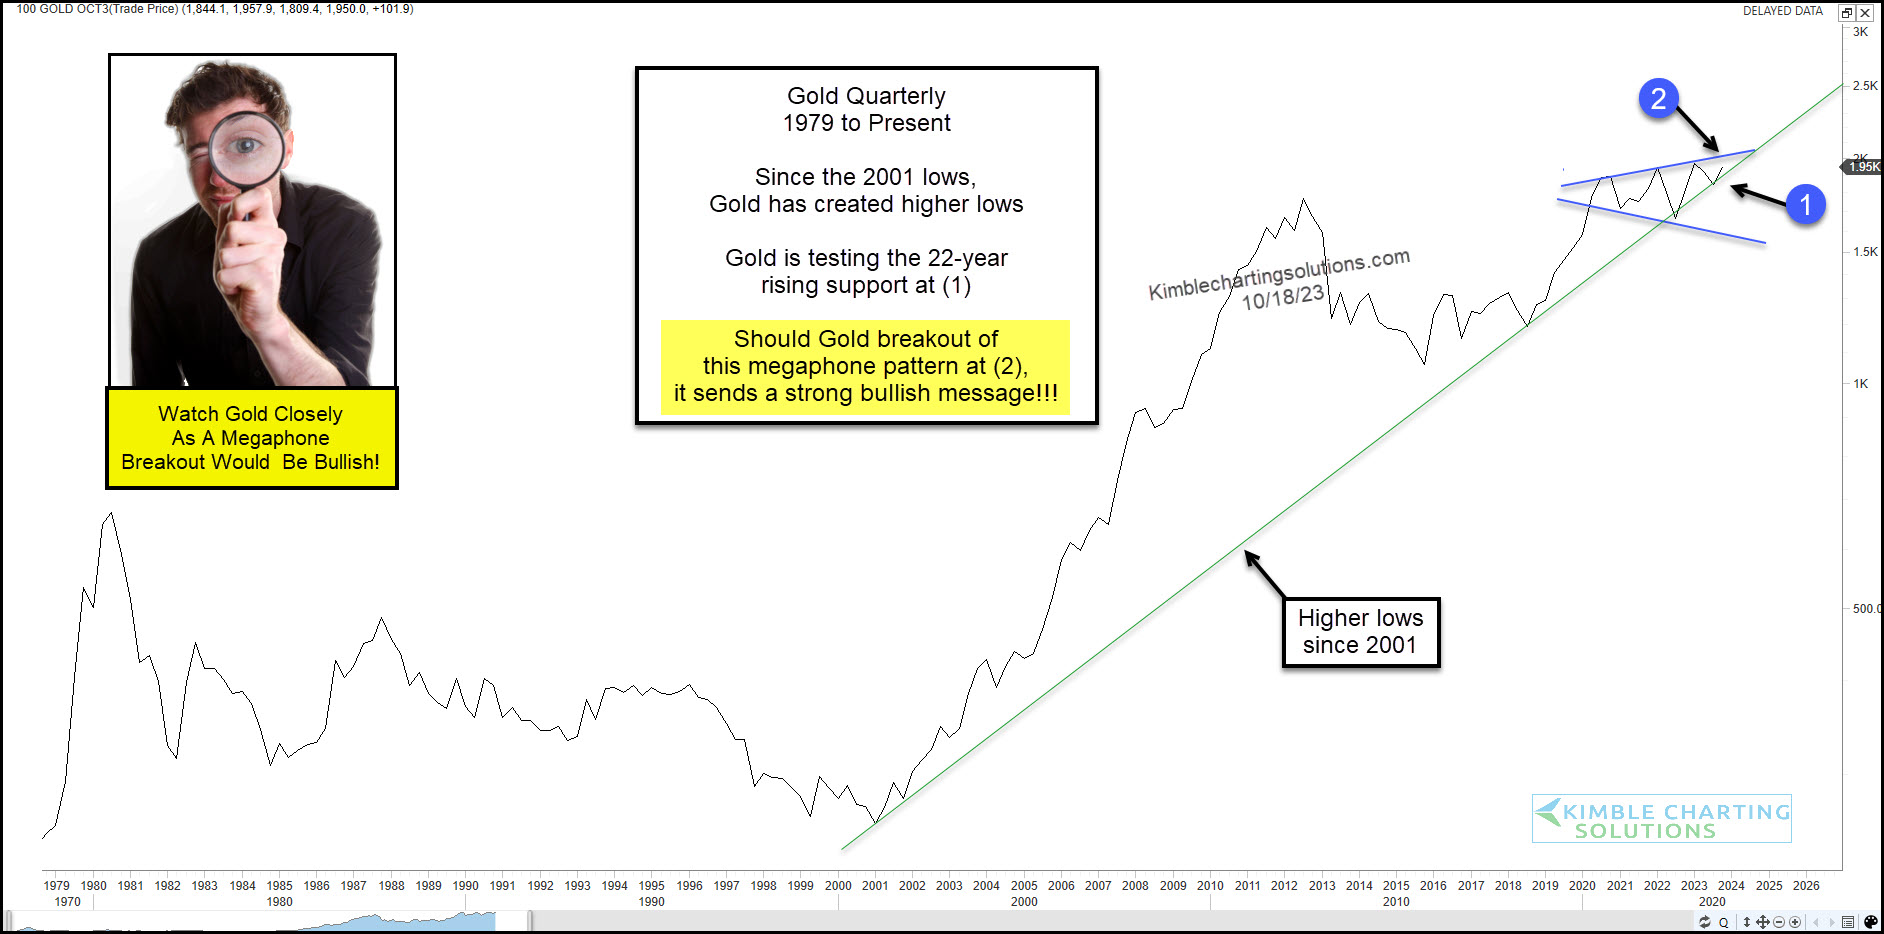
Today’s long-term “quarterly” line chart highlights a potentially bullish pattern.
First, gold has continued to bounce off its 22-year rising trend support line at (1). And second, a megaphone pattern at (2) shows price getting squeezed between the upper megaphone resistance and rising trend line support.
So we have another key price support test in play at (1). Bulls need this to hold.
And should Gold breakout at (2), it would be super bullish!
(Click on image to enlarge)

More By This Author:
Gold Prices Clear 5-Month Downtrend, Important Breakout Test In Play
Is It Time For Utilities Stocks To Stop Stinking Up The Joint?
Will Treasury Bonds Crisis Turn Into Opportunity This Month? Bond Bulls Praying Support Holds
Disclosure: Sign up for Chris's Kimble Charting Solutions' email alerts--click here.


