
SPX Monitoring purposes; Long SPX on 12/20/22 at 3821.62
Monitoring purposes GOLD: Long GDX on 10/9/20 at 40.78.
Long Term SPX monitor purposes; Neutral
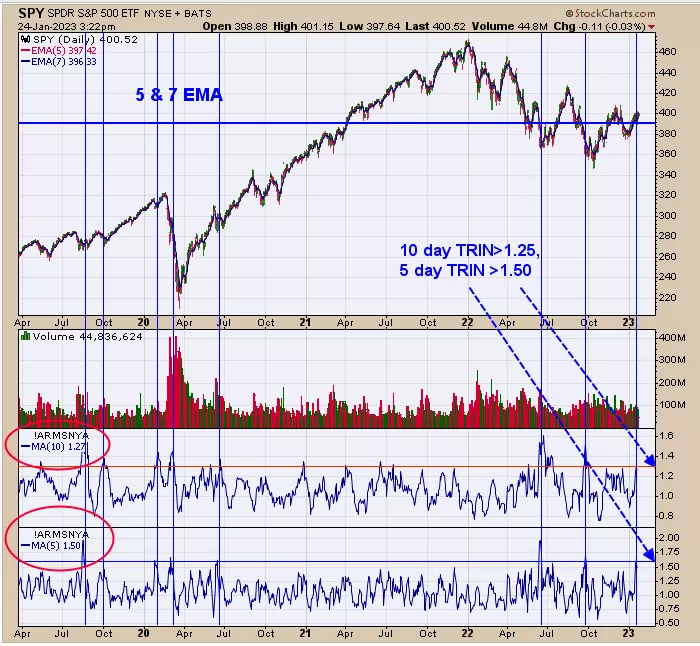
Yesterday we said, “Market bottoms form on panic and the TRIN is one way to identify panic is present. One day trin readings above 1.30 suggest panic is present in the market. The more days of panic readings in a row the larger the bottom that is forming.” The bottom window is the 5-day average of the TRIN and the next window up is the 10-day average of the TRIN. The chart goes back to mid-2019. We marked with blue lines the times when the 10-day TRIN closed above 1.25 and the 5-day TRIN closed above 1.50. When these two average TRIN readings are pared up the market was at least near a basing period and suggesting a rally was about to start or has already started. The 410 on the SPY is still possible short term. For a confirmed uptrend, would also like to see the Summation index reach +1000 (see page two). Join us at @OrdOracle
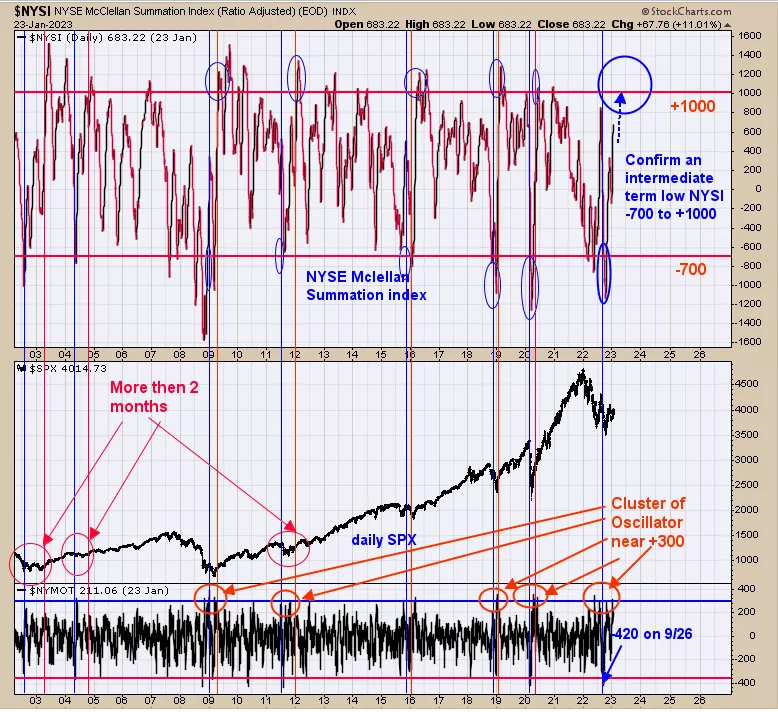
Again we updated this chart from yesterday. The current NYSE Summation index reading is +683 and moving higher and shy of the +1000 target by +317. There is a good chance that the +1000 Summation index will be reached. Bullish intermediate-term rallies form when the NYSE McClellan Summation index falls below -700 (capitulation) and then rallies to +1000 (Sign of Strength). The summation index reached below -1000 in early October and now we are looking for a +1000 to confirm an intermediate-term low. The bottom window is the NYSE McClellan Oscillator. We circled in red the times when the Oscillator reached a cluster of +300. The current cluster of +300 readings is the largest bunch circled in red, which suggests a high degree of accumulation.”
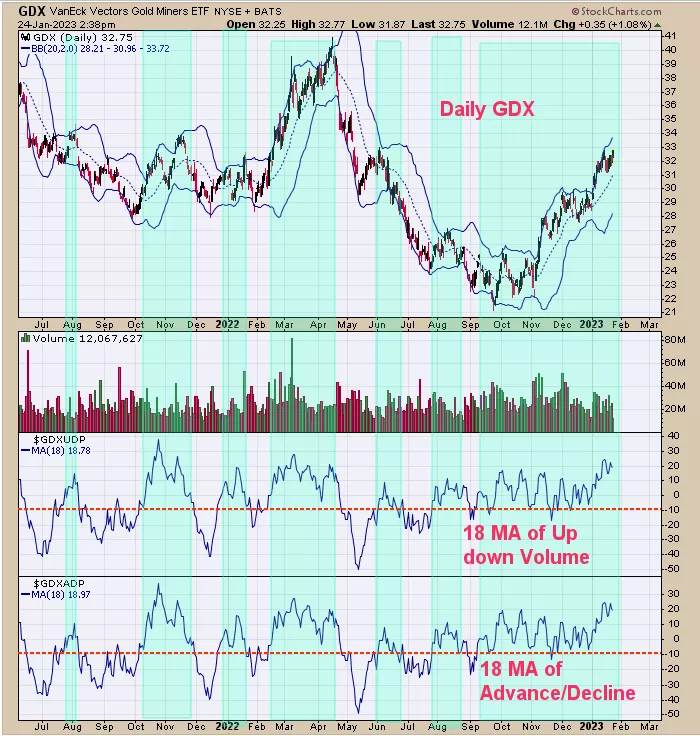
We updated this chart from yesterday. Both indicators are well above -10, suggesting the rally can continue. We said yesterday, “The bottom window is the 18-day average for the advance/Decline percent for GDX and the next window up is the 18-day average for the Up down Volume percent for GDX. It turns out that when both indicators are above -10 (noted in light blue) then GDX is in an uptrend. In general, both indicators have been above -10 Since September. Both indicators' current readings are coming in at +19 and suggest the current rally will continue. May see a continued march right back to the old highs near 41.00. A fall below -10 on both indicators will be a short-term bearish sign.”
More By This Author:
A High Degree Of Accumulation
Zweig Breadth Thrust
A Large Move


Comments
Log in or sign up to join the conversation.