

Image Source: Unsplash
An Introduction
Last year I read a number of insightful articles on the coming surge in gold and silver equities which caused me to do my own research and that led me to creating my Gold/Silver ETFs Portfolio of 5 ETFs that best represented the evolvement of a cross-section of the gold/solver equities sector. To my delight that portfolio is UP 123.5% YTD. That being said, there is still time to do your homework and make some rewarding investment decisions. Here's why.
Gold has increased by 46.8% YTD (and silver by 60.9%) and Gold and silver equities tend to rise 2 to 3 times faster than gold and silver and that is indeed what is currently happening. Why? Because their costs are relatively fixed and, with the increasing prices of physical gold and silver, the value of each troy ounce (see definition of "troy" ounce here) mined flows straight to the bottom line causing their stocks to go ballistic. GDX (with an average market cap of approx.$391M), for example, is UP 125.3% YTD and the GDXJ (with an average market cap of $141M) is UP 131.6% YTD.
Let me explain further. Average all-in sustaining costs for major producers range from $1,080 to $1,220 per troy ounce (source) and with spot prices for gold, for example, currently more or less triple that, producer margins are exploding as illustrated in the following chart compliments of the World Gold Council and U.S. Global investors.
(Click on image to enlarge)

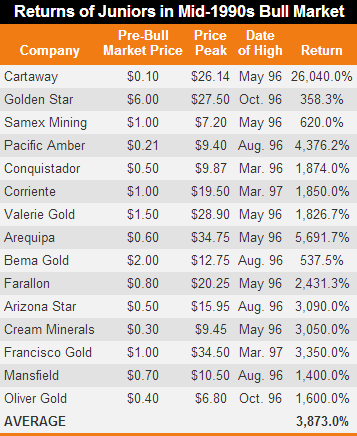
With profits increasing dramatically, the major producers are flush with cash which, if history is any indicator, they will likely eventually invest in the smaller cap producers, those mining companies in development and the many juniors explorers, causing many of the latter company stock prices to go parabolic (the tables below are compliments of Jeff Clark) with many of them becoming 10-baggers (i.e. 1,000% gains, or more) back in 1979/80...
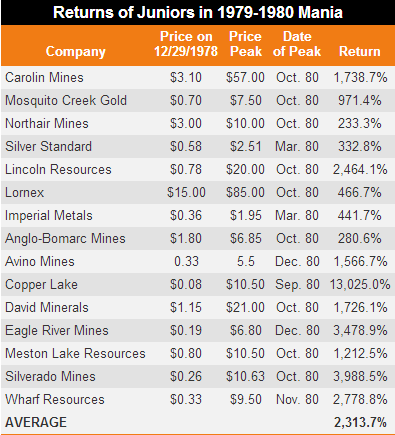
and again in the mid 1990s.
Our Gold/Silver ETFs Portfolio
As I mentioned in the Introduction my Gold/Silver ETFs Portfolio of 5 ETFs represents a cross-section of the gold/solver equities sector and the constituents are identified below with their performances in September and YTD a description of the make-up of each and a chart of the portfolios performance YTD.
- VanEck Gold Miners ETF (GDX): UP 20.9% In September; UP 125.3% YTD
- Profile: consists of larger-cap gold producers
- # Constituents: 51
- Avg. Market Capitalization: $391M
- VanEck Junior Gold Miners ETF (GDXJ): UP 23.7% In September; UP 131.6% YTD
- Profile: consists of junior and mid-tier gold producers
- # Constituents: 99
- Avg. Market Capitalization: $141M
- Sprott Junior Gold Miners ETF (SGDJ): UP 24.5% In September; UP 115.8% YTD
- Profile: consists of small- to mid-cap companies engaged in the exploration, development, or early-stage (not full-scale) production of gold.
- # Constituents: 33
- Avg, Market Capitalization: $140M
- Global X Silver Miners ETF (SIL): UP 23.3% In September; UP 125.5% YTD
- Profile: consists of top silver producers and some gold-silver hybrids
- # Constituents: 44
- Avg. Market Capitalization: $232M
- U.S. Global GO GOLD and Precious Metals Miners ETF (GOAU): UP 20.5% In September; UP 112.4% YTD
- Profile: consist of Royalty companies that receive a percentage of revenue or profit from a mine (e.g., 1–5% of gross sales) while Streaming companies that pay upfront for the right to purchase a portion of future metal production at a fixed, discounted price (e.g., $450/ozt gold).
- # Constituents: 33
- Avg. Market Capitalization: $330M
Comparison Chart Of Constituent Performances YTD
(Click on image to enlarge)
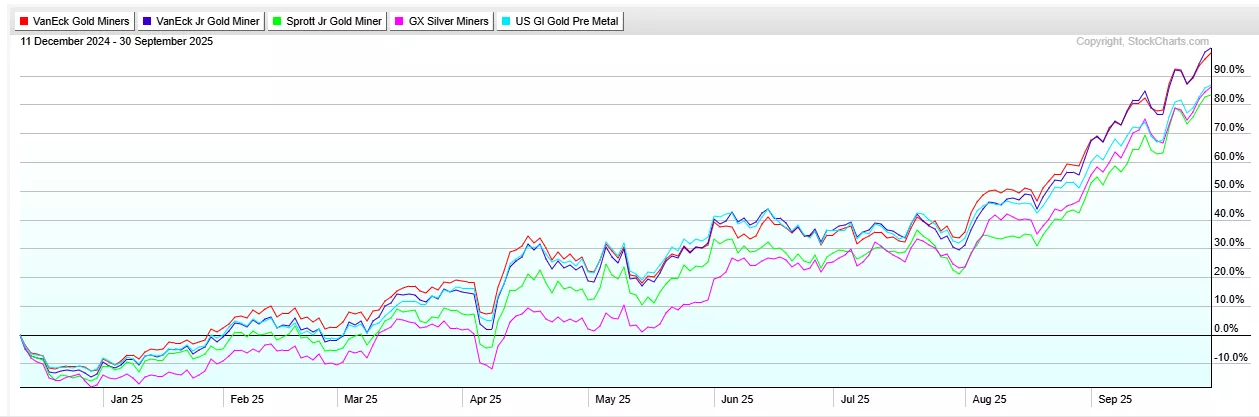
Source: StockCharts.com
Chart Of Performance Of Gold/Silver ETFs Portfolio
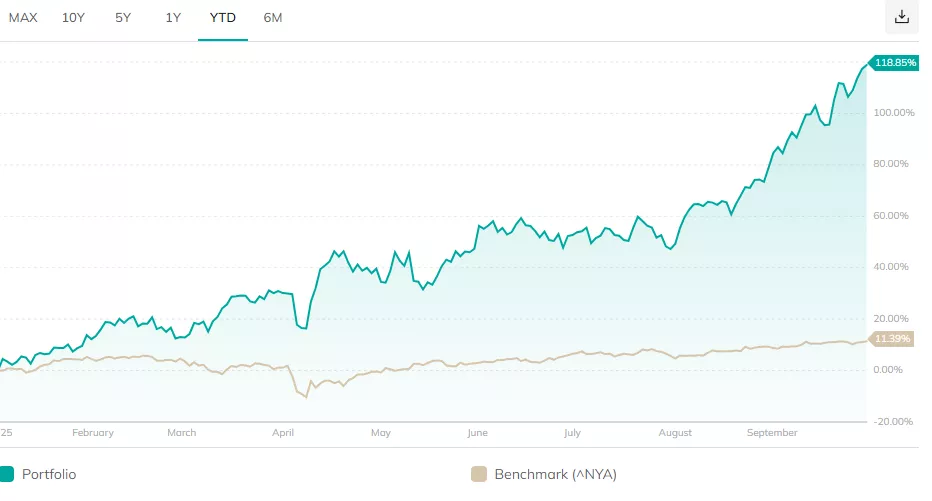
The above portfolio chart has been generated using the tools provided by PortfoliosLab.com and easy step-by-step instructions are available here to help you create a chart of your own portfolio or that of a client. It's easy, fast and free.
Conclusion
We are on the verge of a tremendous boom in gold and silver equities. As physical gold and silver continues to increase more and more investors/speculators will flood into gold/silver futures which will catapult physical gold and silver prices higher and that will motivate investors to chase gold/silver further increasing the margins of the gold/silver producers and the likelihood of many of them buying out the "mining' companies - the developers and juniors - in the market, or at least expressing interest in doing so which will cause these "mining' companies to rocket higher!
More By This Author:
Our Model AI Semiconductor Portfolio Continues To Outpace The Nasdaq More Than 2-To-1
Pure-Play Quantum Computing Stock Portfolio Up +60% MTD - Here's Why
This Selection Of ETFs Has Outperformed The Nasdaq By 212% YTD


.webp)
Comments
Log in or sign up to join the conversation.