
Introduction
Below is how the constituents in my personal portfolio of ETFs have performed MTD, in descending order, and YTD, compared to that of the Nasdaq (QQQ) along with a description of each constituent plus a chart of the performance of the constituents in comparison to each other, and collectively, in chart form.
Returns By MTD & YTD
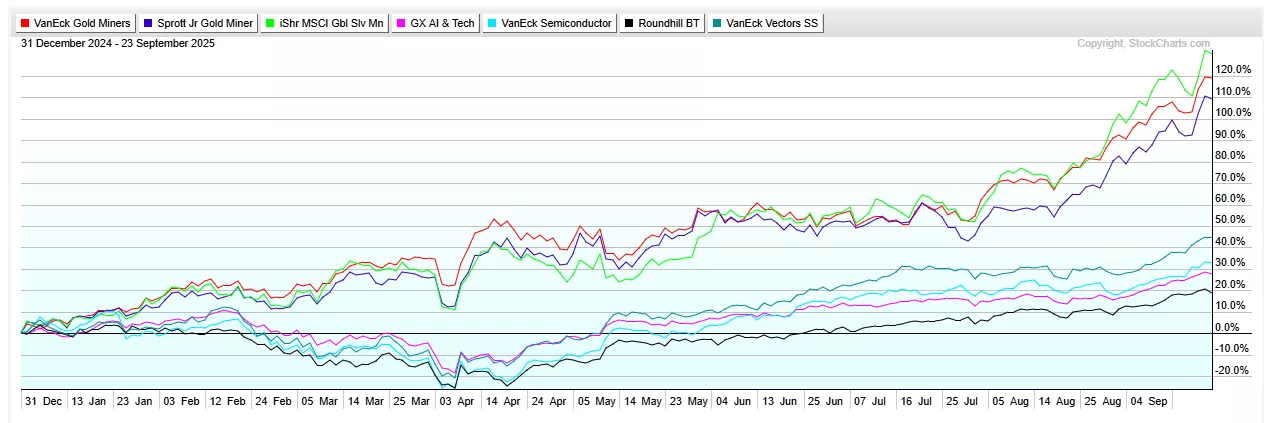
- Sprott Junior Gold Miners (SGDJ): UP 16.7% MTD; UP 102.3% YTD excluding dividends
- Focus: tracks an equity index of small-cap (avg. mkt. cap. of $2B) gold mining firms that are weighted by price momentum for gold explorers and by revenue growth for gold developers.
- Assets Under Management (AUM): $234M
- Expense Ratio: 5%
- Dividend Yield: 3.1%
- # Holdings: 34
- iShares MSCI Global Silver & Metal Miners (SLVP): UP 16.1% MTD; UP 118.5% YTD excluding dividends
- Focus: a market-cap-weighted index of global companies (avg. mkt. cap. of $60B) that earn the majority of their revenues from silver mining
- Assets Under Management (AUM): $492M
- Expense Ratio: 0.39%
- Dividend Yield: 0.5%
- # Holdings: 41
- VanEck Gold Miners (GDX): UP 14.5% MTD; UP 113.4% YTD excluding dividends
- Focus: a market-cap-weighted index of global gold-mining firms (avg. mkt. cap. of $58B)
- Assets Under Management (AUM): $19.9B
- Expense Ratio: 0.51%
- Dividend Yield: 0.54%
- # Holdings: 65
- VanEck Social Sentiment (BUZZ): UP 11.0% MTD; UP 41.3% YTD excluding dividends
- Focus: holds 75 U.S.-listed firms with the most positive investor sentiment online
- Assets Under Management (AUM): $109M
- Expense Ratio: 0.76%
- Dividend Yield: 0.35%
- # Holdings: 75
- Global X AI & Technology (AIQ): UP 9.1% MTD; UP 27.2% YTD excluding dividends
- Focus: tracks a market-cap-weighted index of developed-market equities involved in artificial intelligence & big data.
- Assets Under Management (AUM): $5.3B
- Expense Ratio: 0.68%
- Dividend Yield: 0.12%
- # Holdings: 92
- Roundhill Magnificent Seven (MAGS): UP 8.9% MTD; UP 19.6% YTD excluding dividends
- Focus: an actively managed fund offering exposure to the largest and most liquid leading technology stocks
- Assets Under Management (AUM): $3.34T
- Expense Ratio: 0.29%
- Dividend Yield: NIL
- # Holdings: 7
- VanEck Semiconductor (SMH): UP 8.8% MTD; UP 30.4% YTD excluding dividends
- Focus: based on a market-cap-weighted index of 25 of the largest US-listed semiconductors companies.
- Assets Under Management (AUM): $32.1B
- Expense Ratio: 0.35%
- Dividend Yield: 0.34%
- # Holdings: 26
Summary:
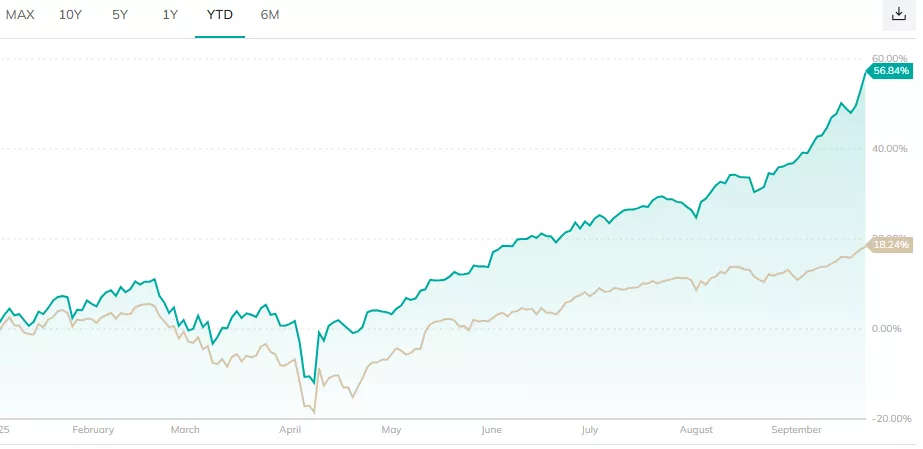
My Personal Select ETF Portfolio is UP 10.6% MTD and UP 56.8%, YTD.
Performance Comparison Of Portfolio Constituents YTD
Portfolio Performance Chart -YTD
The above portfolio chart has been generated using the tools provided by PortfoliosLab.com and easy step-by-step instructions are available here to help you create a chart of your own portfolio or that of a client. It's easy, fast and free.
Conclusion
My Personal Select ETF Portfolio is UP 56.8%, YTD, compared to the Nasdaq (QQQ) which has only gone UP 18.2% during the same period. That represents an increase of 212.1%.
Addendum
- If you (or your financial advisor) are interested in creating a chart of the performance of a portfolio you finally can. Just visit follow the simple step-by-step instructions in my post entitled "How To Create A Chart Of the Performance Of A Portfolio". It's fast, it's easy and it's free!
- Please note that I have NO direct or indirect financial interest in PortfoliosLab. I am just a very impressed subscriber who finally found a way to provide charts of the performance of my various model portfolios in my frequent articles as posted on TalkMarkets.
More By This Author:
Our AI Semiconductor Model Portfolios Collectively Shows 29% Gain YTD
Semiconductor EDA Software Company Synopsis Fell 29% Last Week - Here's Why
Pure-Play Quantum Computing Stocks Jumped +25% Last Week - Here's Why


.webp)
Comments
Log in or sign up to join the conversation.