New Spot Bitcoin ETFs Are Crushing The Supply/Demand Balance

Image Source: Pexels
Key Takeaways
- The launch of 11 distinct spot Bitcoin ETF strategies in the first quarter of 2024 has resulted in approximately $60 billion in assets under management, a historic success for ETF launches.
- The upcoming Bitcoin halving event in April 2024, where the block reward paid to miners will decrease, suggests a potential shift in the supply/demand balance toward demand outpacing supply, which could lead to upward pressure on the price of Bitcoin.
- ETF buying has outpaced the creation of new Bitcoin since the launch of the ETFs, indicating increased investor interest in gaining exposure to Bitcoin through familiar brokerage platforms.
One of the biggest stories of the first quarter of 2024 in U.S. ETFs has been the launch of 11 distinct spot Bitcoin strategies. Jan. 11, 2024 is truly a date that will go down in ETF history, similar to the launch of SPDR’s gold trust in 2004,1 or even SPDR’s S&P 500 Index trust in 1993.2
As we write these words, roughly $60 billion in assets under management are represented by these 11 spot Bitcoin ETF strategies.3 As is often the case, this $60 billion represents a wide dispersion, with a few quite large strategies, some mid-sized, and some smaller.
The Halving
In April 2024, an event referred to as “the halving” will occur within the Bitcoin protocol. This is widely anticipated, in that it is written into the code that the block reward paid to Bitcoin miners will shift from 6.25 Bitcoin to roughly 3.13 Bitcoin.
Bitcoin’s protocol has a so-called “halving cycle” of about four years, so we have seen these events before—rewards started at 50, dropping first to 25, then 12.5 and then 6.25. This will keep happening between now and 2140, when all 21 million Bitcoin slated to ever be created will exist.
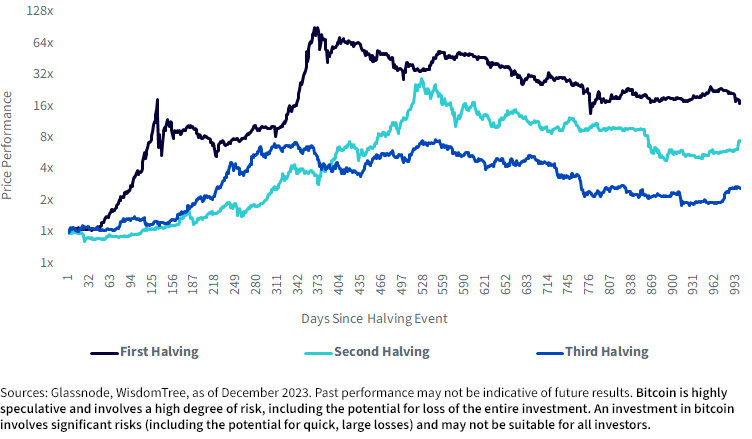
Figure 1 is a chart that we have shown before, noting that if we scale Bitcoin’s price on the day of a past halving to 1.0, we see that over the subsequent roughly 2.5-year period, there was further appreciation in each of the three cases.
- On the one hand, we can think about Bitcoin on a supply/demand basis. If demand is outpacing supply, there should be upward pressure on the price. The halving indicates that there is less new Bitcoin supply coming into the world, so if demand merely remains the same, the supply/demand balance immediately shifts more toward demand outpacing supply.
- To be balanced, we have to also recognize that many things influence the behavior of investors across the overall Bitcoin market. Prior halving cycles being associated with Bitcoin’s price appreciation cannot tell us with certainty what will occur in the future.
Figure 1: Bitcoin’s Price Behavior After Three Halving Cycles So Far

Spot Bitcoin ETFs: A New Source of Demand
One of the most-loved attributes of Bitcoin regards the certainty of supply based on the protocol’s code over time. For instance, we know that in 2140, there will be 21 million Bitcoin, and we know that nothing can occur to change this. We know, as stated with the halving, the minting of new supply coming online is being reduced, by half, roughly every four years.
This is in direct contrast to fiat currency systems where governments can decide to print more units of currency on an unlimited basis. Throughout history, we’ve seen examples of fiat currencies losing their value and primacy due to further and further printing. We have seen the U.S. dollar lose value over time after breaking the link to gold in 1971,4 allowing the U.S. government to print more and more currency without needing it to be backed by units of gold.
It was hypothesized that, if the Securities and Exchange Commission approved spot Bitcoin ETFs, new sources of demand to hold Bitcoin would open up. In 2004, a new option opened up for investors who did not want to go through the hassle of acquiring and storing physical gold bars. In a similar fashion, in 2024, an option opened up to allow investors to gain exposure to spot Bitcoin through familiar brokerage platforms on which they trade ETFs backed by other types of assets.
Now, a little more than two months into the journey, we can review how the supply/demand story has been evolving in Bitcoin and whether we can clearly see any influence from the ETFs.
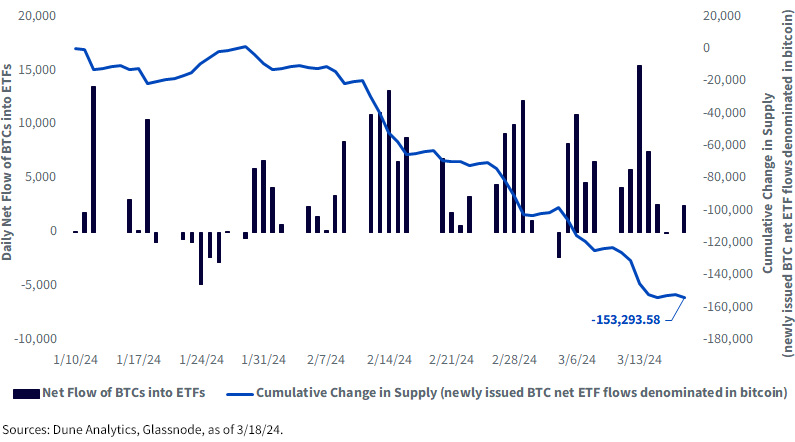
Figure 2 shows us:
- It looks like many are interested in Bitcoin: One hypothesis advanced before the ETFs launched regarded an increase in investor types—those that were precluded from setting up their own crypto wallets, for example—being able to gain exposure. The daily net flow of BTCs into ETFs is absolutely skewed to the positive end of the spectrum, and we note that there were still many investors working at firms where central home offices have not yet issued blanket approvals to use these products across the board.
- ETF buying has outpaced Bitcoin issuance: Bitcoin purchases by ETFs have outpaced the creation of new Bitcoin, over this specific period, by roughly 153,294 units. This may not always be the case, and we note that the overall value of the Bitcoin market is over $1 trillion, as we write, but there are large volumes of Bitcoin that are proven to not trade with a high frequency. The space is transparent—we can see the ETF buying, we can see the wallets, and we can see how long it has been since individual units have moved. The only thing we do not know is exactly when or why owners may trade.
Figure 2: ETF Demand vs. Bitcoin Issuance

Conclusion: Bitcoin Is about Supply and Demand
There is no shortage of different models that can create a potential price or range of price levels that might be appropriate for Bitcoin. The space is so new, only starting in 2009, that there is not yet a universally accepted valuation methodology—as opposed to, for instance, discounted cash flows for stocks or bonds.
While investors continue to search and refine better ways to develop price targets, we find it more informative to consider supply and demand. Right now, it appears that ETF demand is high, and we also know that the halving is coming. Now, ETF demand can change quickly—this is the beauty of the structure—but this will be visible and transparent, and we (as well as others) will be able to monitor these trends in nearly real time.
Footnotes
- 1 The SPDR Gold Shares Strategy (GLD) launched on 11/18/04. As of 3/19/24, it had more than $58 billion in assets under management.
- 2 The SPDR S&P 500 ETF Trust (SPY) launched on 1/22/93. As of 3/19/24, it had more than $526 billion in assets under management.
- 3 Source: Bloomberg, with data, as of 3/19/24.
- 4 Source: Sandra Kollen Ghizoni, “Nixon Ends Convertibility of U.S. Dollars to Gold and Announces Wage/Price Controls,” Federal Reserve History, 11/22/13.
More By This Author:
Q4 2023 Earnings: Quality Growth Takes Center StageWait, Did Europe Really Outperform The U.S. Over The Last Three Years?
With Nvidia at $2 Trillion, Where Is the Risk Concentrated?
Disclaimer: Investors should carefully consider the investment objectives, risks, charges and expenses of the Funds before investing. U.S. investors only: To obtain a prospectus containing this ...
more


