
Nasdaq IShares Biotechnology ETF – IBB Elliott Wave Technical Analysis
Nasdaq iShares Biotechnology ETF – IBB (1D) Elliott Wave Technical Analysis
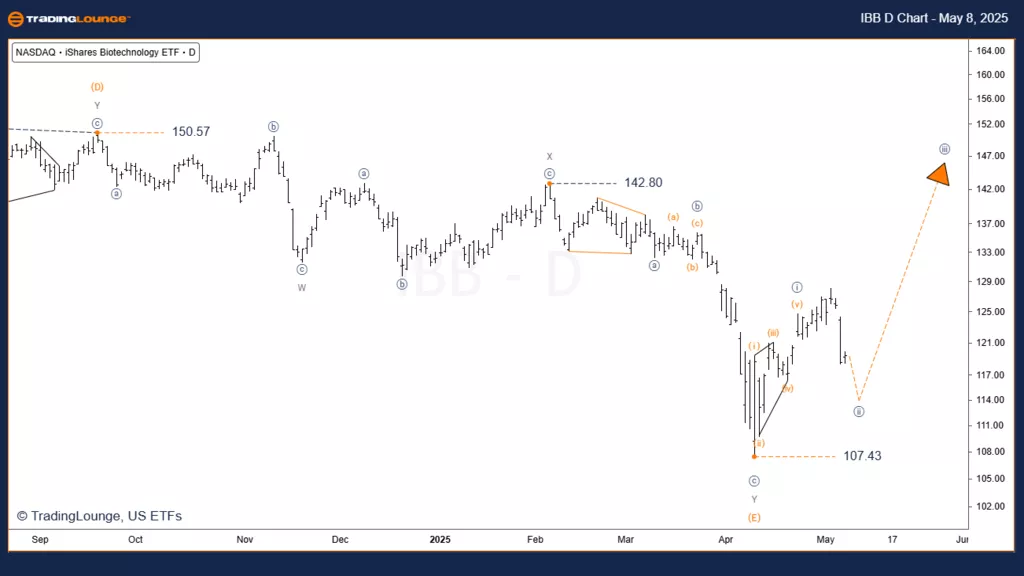
Daily Chart
Function: Major Trend
Mode: Motive
Structure: Triangle
Position: Wave 1 of [5]
Direction: Uptrend
Details:
The wave [4] triangle in IBB is complete, signaling a major buying opportunity.
The following move is an impulsive post-triangle thrust, often very strong.
Currently, wave 1 of [5] is underway, expected to complete near the $150 level before wave 2 begins.
The clearest confirmation will occur at $142.80.
Invalidation Level: $107.43
Nasdaq iShares Biotechnology ETF – IBB (4H) Elliott Wave Technical Analysis
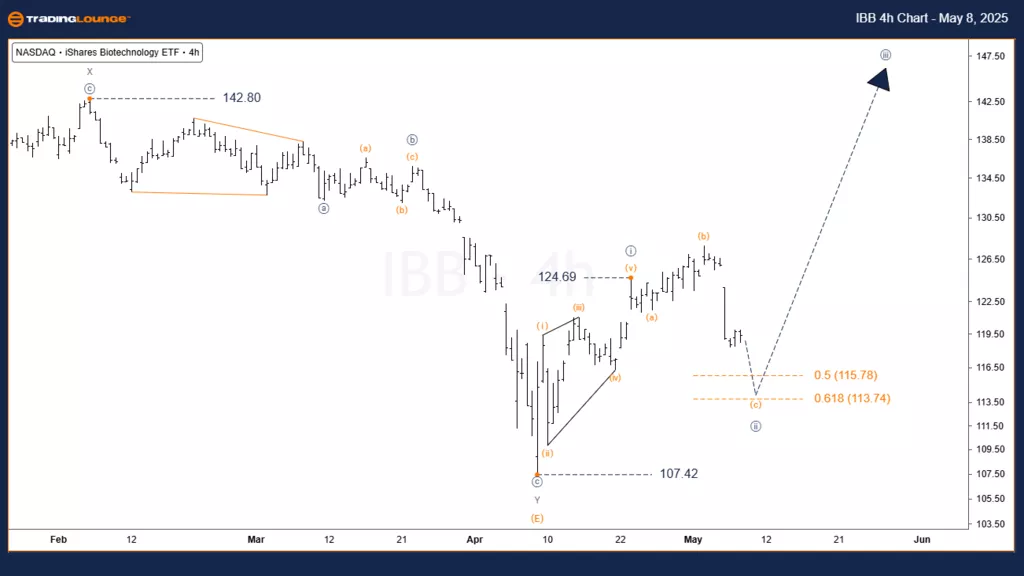
Hourly Chart
Function: Major Trend
Mode: Motive
Structure: Impulse
Position: Wave [ii]
Direction: Minor Correction
Details:
The current decline is only a brief pause within a major rally.
Wave [ii] is retracing the leading diagonal wave [i] as an expanded flat structure.
Afterward, the next move is expected to be an impulsive rally towards $142.80.
The $125 level offers a favorable buying opportunity, with $107.43 as the stop-loss level.
The $117 mark serves as key support.
Invalidation Level: $107.43
Conclusion
The summary of the Elliott Wave analysis for IBB is:
The rally is young and poised for a significant extension, representing a post-triangle thrust.
Price action is expected to retrace the entire triangle formation and possibly move far beyond.
$125 is considered an excellent buying area, with $107.43 as the risk management stop-loss.
This setup provides a compelling buying opportunity, particularly for ETF investors.
Traders must adhere to Elliott Wave rules and closely monitor invalidation levels to mitigate unnecessary losses.
Technical Analyst: Simon Brooks
More By This Author:
Elliott Wave Technical Forecast: Block, Inc. - Thursday, May 8
Elliott Wave Technical Analysis: Qualcomm Inc. - Thursday, May 8
Elliott Wave Technical Analysis: U.S. Dollar/Japanese Yen - Thursday, May 8
At TradingLounge™, we provide actionable Elliott Wave analysis across over 200 markets. Access live chat rooms, advanced AI & algorithmic charting tools, and curated trade ...
more

