
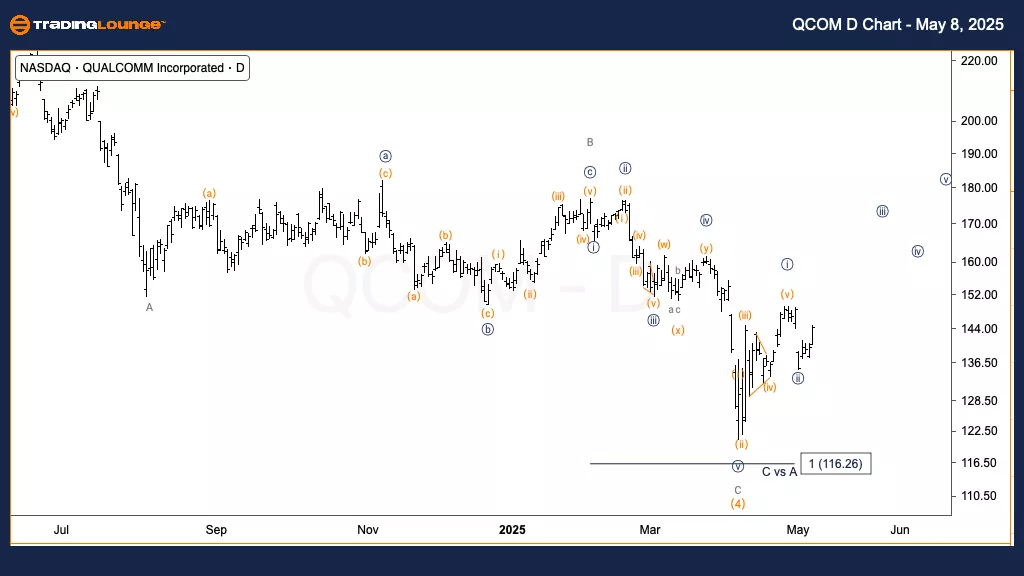
Qualcomm Inc. (QCOM) Daily Chart
QCOM Elliott Wave Technical Analysis
FUNCTION: Trend
MODE: Impulsive
STRUCTURE: Motive
POSITION: Wave {iii} of 1
DIRECTION: Upside in wave 1
DETAILS: A wave {i}-{ii} structure appears completed, setting the stage for further upside. Support above $150 would strengthen the bullish outlook.
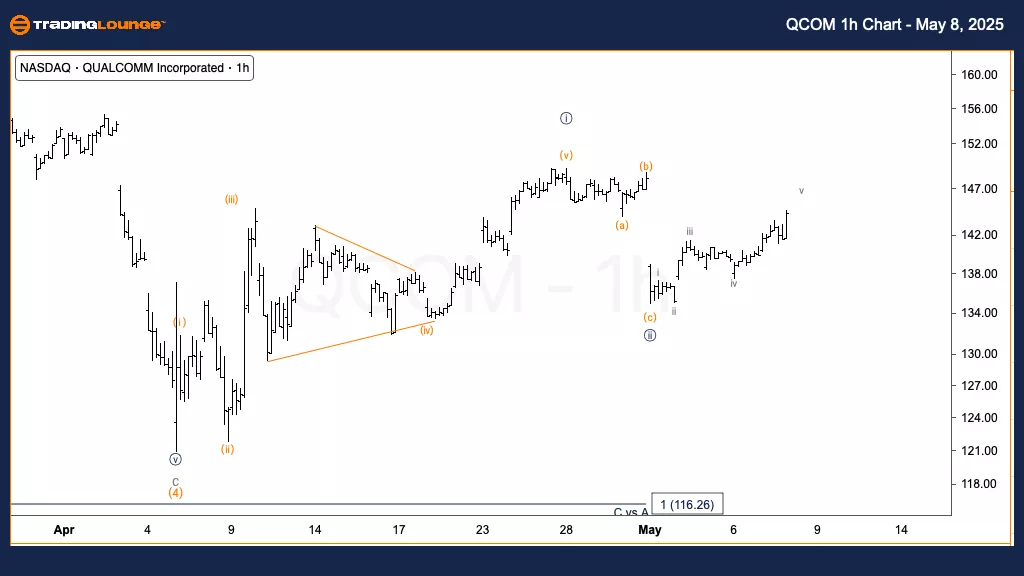
Qualcomm Inc. (QCOM) 1H Chart
QCOM Elliott Wave Technical Analysis
FUNCTION: Trend
MODE: Impulsive
STRUCTURE: Motive
POSITION: Wave (i) of {iii}
DIRECTION: Upside in wave {iii}
DETAILS: After a three-wave corrective move, a five-wave impulsive rise suggests wave (i) is forming at the start of wave {iii}.
This analysis examines Qualcomm Inc. (QCOM) through Elliott Wave Theory on both the daily and 1-hour charts, outlining current structure and potential developments:
QCOM Elliott Wave Technical Analysis – Daily Chart
The daily chart of Qualcomm (QCOM) shows an initial impulse phase with waves {i} and {ii} seemingly completed, pointing to the start of wave {iii}. A sustained move above $150 would confirm further bullish momentum and likely propel the stock into a stronger rally phase.
QCOM Elliott Wave Technical Analysis – 1H Chart
On the 1-hour chart, Qualcomm (QCOM) appears to have ended a three-wave corrective pattern in wave {ii}, followed by a five-wave impulsive move suggesting the emergence of wave (i) of {iii}. This setup aligns with the broader bullish trend and could provide a favorable continuation pattern.
Technical Analyst: Alessio Barretta
More By This Author:
Elliott Wave Technical Forecast: Block, Inc. - Thursday, May 8
Elliott Wave Technical Analysis: U.S. Dollar/Japanese Yen - Thursday, May 8
Elliott Wave Technical Analysis - Euro Stoxx 50 Index


Comments
Log in or sign up to join the conversation.