

Summary
- I have been writing about the Fed hurting the stock market since November 2021 - stock indexes are 20-40% off their highs.
- The popular narrative now is centered around Fed interest rate increases, pauses and cuts later - it's wrong.
- The narrative in several months will finally be about what really matters - Quantitative Tightening.
- The inverted yield curve will be a tool to refinance a trillion dollars of U.S. Treasury debt coming due in 2023 to longer terms.
- QT can be ended by year-end for U.S. debt purposes, but until that is apparent to markets, stocks and real estate will stay under pressure.
The narrative that traders have been spinning, since before the Federal Reserve raised interest rates, has been: "the Fed will have to pause and pivot on interest rates sooner than later."
They traders have been wrong so far, and, in fact, not even focused on the right topic. While they spun bullish yarns, the S&P 500 Index (SPX) is about 20% off of its peak. Small caps, mid caps and emerging markets have all had even worse corrections.
Markets move based on money flows. In the simplest terms, when more money demands assets, prices rise. The opposite is also true. Supply and demand.
The big money, which is the Federal Reserve, governments, financial institutions, and family offices, controls 80-90% of the investing money. That is where to look for signals on which direction asset prices will move in the next year or two.
So, stop following the trader narratives based on retail sentiment that controls 10-20% of the market's money and really "follow the money."
Ongoing Fed Coverage
Way back in November 2021, I warned that Federal Reserve policy was going to take a bite out of the bull market and turn it into a bear market.
I got ridiculed and was told by certain magician traders I was wrong. Some claimed Fed policy and stock prices were not correlated, while predicting new all-time highs were imminent.
All the while, I predicted a 20% plus stock market correction in 2022 because of Fed policy. Here's a brief history of important pieces to track my thoughts:
The Fed Warned You, Are You Going To Fight The Fed?
Overvalued, Overbought & Overleveraged Market While The Fed Tightens, What Could Go Wrong?
Macro Dashes: The Fed Is Reloading Its Bazooka For Next Time
Kirk Spano's Q2 2022 Outlook And Game Plan For A Tighter Fed
Macro Dashes - The Fed Could Cause Stagflation Next
TLT: JPOW, In The Fed, With A Blunt Tool, Just Killed TINA
I have been making a simple argument: Federal Reserve actions have a nearly perfect correlation to asset prices, albeit, sometimes with a time lead or lag depending on what traders have the power to influence.
The Middle Of The Market
The last part about "trader power" is important. Traders and the retail herd they try to manipulate via social media, blogs, Reddit, podcasts and financial TV, can drive stock market prices in the short term.
If you are a gifted trader, feel free to try to trade the short term. About 1 in 5 who try, will be profitable, but none yet has made the billionaires list.
Gifted trader Paul Tudor Jones had an observation about trading:
“I believe the very best money is made at the market turns. Everyone says you get killed trying to pick tops and bottoms and you make all your money by playing the trend in the middle. Well for twelve years (longer now) I have been missing the meat in the middle but I have made a lot of money at tops and bottoms.”
I call the period between long-term pivots the "middle of the market." During the bull phase, there is cheap margin, plentiful cash, and the madness of crowds driving prices up with some effect.
Eventually, margin becomes less cheap and cash is less plentiful. Tighter financial conditions cause FOMO to end and the bull market to decelerate (usually on the back of the big money cutting investment or cashing in). Then, a bear market develops that gets a lot of argument and stubborn rallies. At some point, though, every bear market has found a capitulation bottom.
What we have seen the past 5 quarters is financial conditions tightening while asset prices have been falling a chop at a time. It's been a fairly standard really.
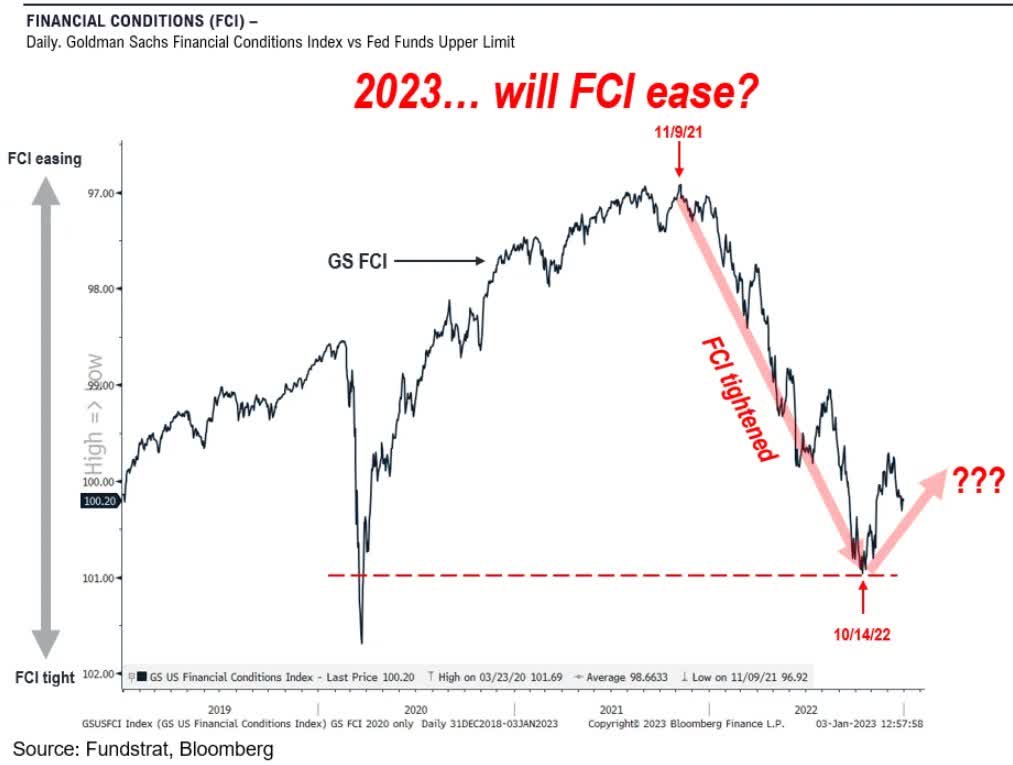
Financial Conditions Index (Bloomberg & FundStrat)
In the chart above, from a week ago, Tom Lee at FS Insights postulates that financial conditions are set to loosen, though he acknowledges the possibility of a double bottom give or take. I'm in the double bottom camp.
I track a similar index that the Chicago Fed puts out.

Chicago Fed Adjusted FCI (Chicago Fed)
In tracking financial conditions, we do not need to be highly precise, just aware of levels and reversals. What we can see with a long range view is that financial conditions, though tight, are not at record levels. There is still room to get tighter.
If we see financial conditions approach 1993-4 tightness, which caused the Great Bond Massacre, then it's very likely that things, like the Repo market, break. Similar to, but likely worse than, September 2019.
Of course, in 2019, we saw the Fed restart QE almost immediately after a period of QT. We should all be aware that the Federal Reserve has a trillion dollars on reserve in case the Repo market breaks again.
That Repo reserve gives the Fed a lot of leeway to push the limits on tightness if supporting the dollar calls for it or if they simply want to see more correction in asset prices - which several past and present Fed Presidents have talked about. We'll talk about other Fed motivations in upcoming articles.
It's The QT, Stupid
A lot of people keep tying interest rates to inflation and the bear market in stocks. It's not quite that simple.
I have been discussing that inflation was not structural since it heated up.
Macro Dashes - Inflation Is Transitory, Most Prices Are Permanent.
My transitory thesis has proven to be right. PPI has decidedly turned over and so has CPI. Year-over-year prints beginning in March, marked by peaks, should be even more favorable.
Here we see PPI has fallen to 5.5% year-over-year, but over the past trailing 3 months the annualized rate has fallen to near the 2% target.
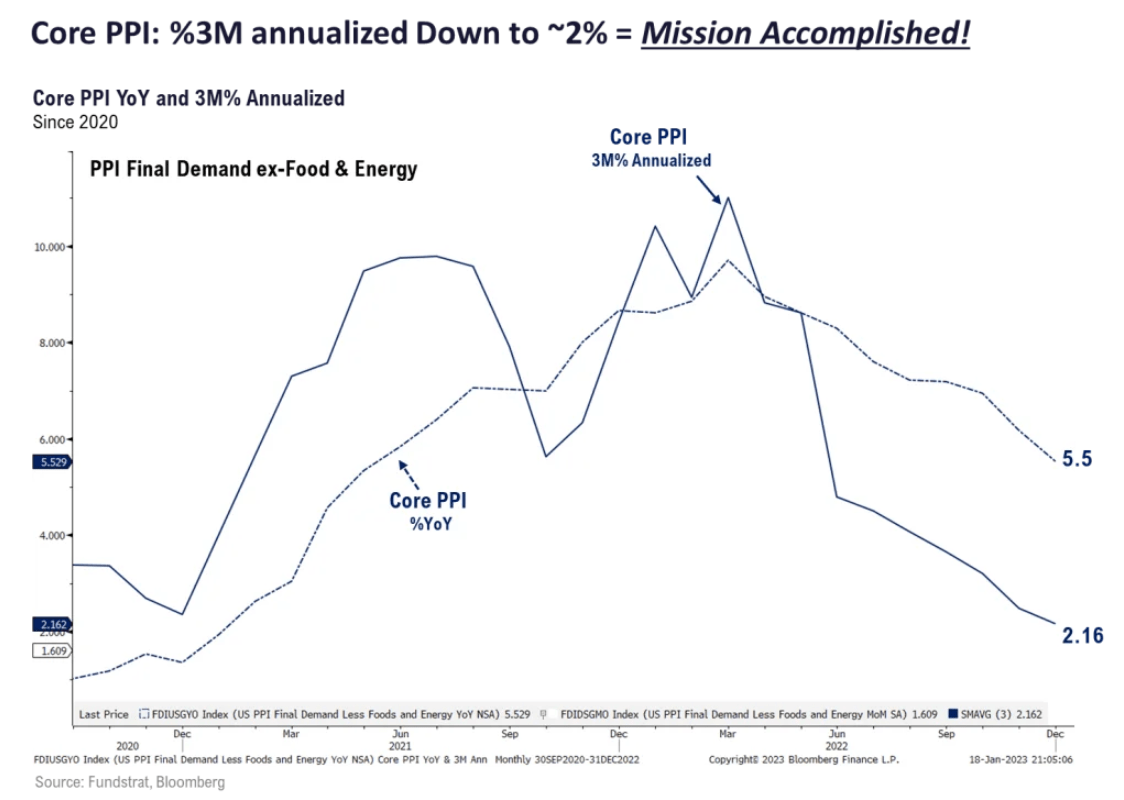
PPI Plunging (Bloomberg & FundStrat)
In December, CPI dropped year-over-year to 6.5%, but also saw a steeper drop over the 3 month period. The noticeable outliers are food and energy, which most voters pay very attention to.

Inflation Components (BLS)
It's easy to see why the Fed might stay tighter longer - to keep food and energy prices from jumping again.
That brings me back to stocks. If interest rates are higher longer and QT is here through most or all of this year, then what does that mean to stock prices. I think this chart shines a spotlight on it.
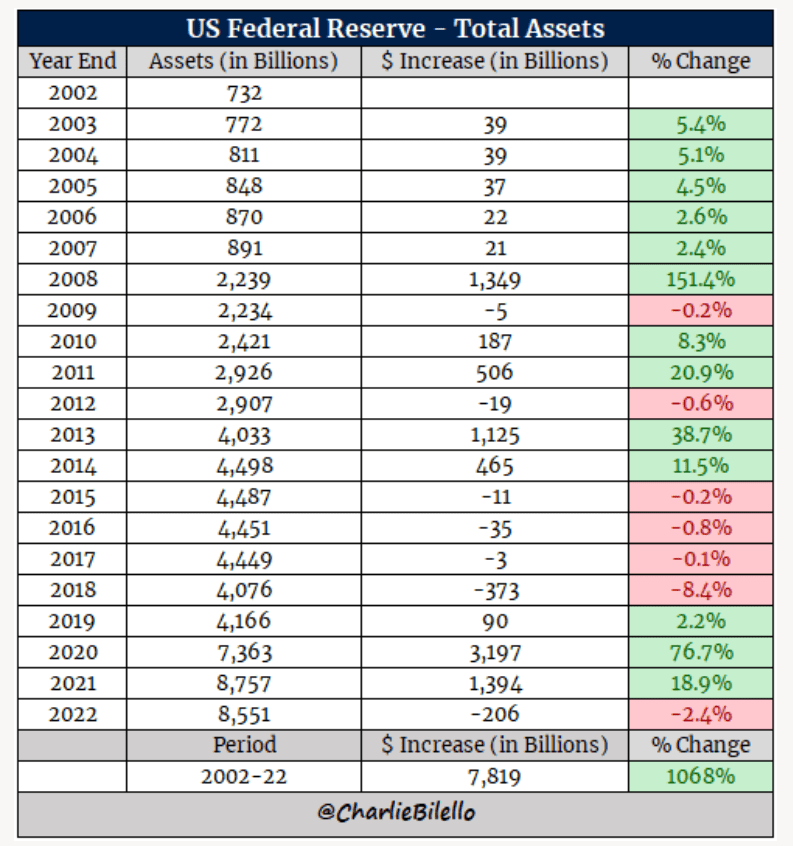
QT vs SPY (@CharlieBilello on Twitter)
Can the correlation of Fed policy on stock prices be any more clear?
It never really was purely interest rates impacting the stock market. It was the money flow into the economy being cut back.
The Fed reduced its balance sheet by a bit over $200 billion in 2022 and we saw the start of a bear market. In 2023, the Fed is scheduled to drain north of a trillion dollars from its balance sheet. This is exactly why I forecast a round trip this year.
My 2023 S&P 500 Futile Forecast (SP500).
Refinancing U.S. Treasury Debt
Here's more motivation for the Fed to keep QT in place a bit longer, even if they stop raising rates in May or June as I expect.
The U.S. issued a lot of 1-5 year treasury debt from late 2019 into 2021. That debt has to be refinanced, with the first trillion being this year and about half trillion the following 4 years:
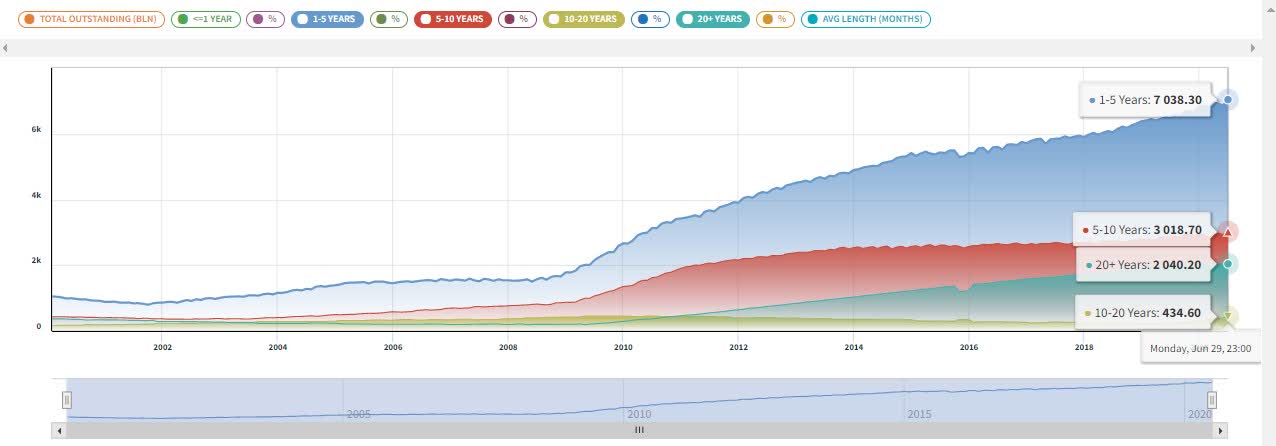
UST Durations (Nasdaq)
Quantitative Easing, aka, QE, lowers demand for treasuries because the Fed is buying them and that lowers interest rates.
Quantitative Tightening, aka, QT raises demand for treasuries because the Fed is not buying them and that raises interest rates.
Pretty simple really. Investors want higher interest rates on their money. Because the U.S. Treasury is the safest large economy bond on the market, U.S. rates can typically be lower than peers, but aren't right now.
With the yield curve inverted, the U.S. is getting a chance to roll short term debt into long term debt. 10 year UST are yielding a bit under 3.5% right now and 20 year UST are yielding a bit over 3.6%. Sophisticated bond investors are fine with a coupon in the middle 3%s now and potential capital gains.
There is still plenty of international demand for U.S. bonds, despite China's and Japan's small pullbacks.

UST Capital Demand (Yardeni.com)
While middle 3%s is no small interest payment to repay given the current Federal Debt, I think it will be fine for a trillion dollars that matures in the 2030s and 2040s. If I am right about a few things, the United States will be running structural budget surpluses by then (we'll argue about that in the comments of a future article).
And, if tightening is followed by loosening, like usual, then we will see another batch of 1-5 year debt at around 2%.
So, until the U.S. Treasury has most of the trillion dollars in refinancing done, QT, which suppresses the long end, will stay in place if all else allows.
More Cover For The Fed To Stay Tight
With food and energy being at risk of prolonged inflation, the Fed could keep financial conditions tight through summer in my opinion. That's consumer vacation, travel and barbecue season. Can't mess with that as the Presidential cycle heats up.
And, the deep recession narratives continue to miss the market for me, too - all due respect to Nouriel Roubini - because labor is so tight.
I have discussed for years that unemployment is the harbinger of recessions. Why would it be different this time? Jerome Powell gave a hint during the last comments when he said these four words:
"We need more people."
Right now, and until we are a few years into a more permissive immigration policy, low unemployment is structural. To change that, we would likely have to see another financial crisis, or, more immigration and robots.
Given that leverage is lower after a year of the bubble leaking and counterparties are far more capitalized than 2007-8, about the only thing that would cause a financial crisis is a big war, or of course, a black swan.
So, if employment is hard to break and the Fed is afraid of energy prices spiking again, on some combination of things, like Saudi Arabia saying they are going to diversify away from the dollar and China reopening from Covid Zero (funny how those things happened at about the same time), why would they run to an easier financial conditions position?
I don't think they would.
I believe that easier financial conditions will come if GDP growth goes negative for a quarter and the threat from potentially higher energy prices abates. The Fed does not want to see stagflation if it can avoid it.
Macro Dashes - The Fed Could Cause Stagflation Next
Another catalyst for easier financial conditions would be just like in 2019: a breaking Repo market. We know the Fed has a QE slush fund for that.
And, another moving part is real estate and shelter costs. Interest rates and the Fed not buying back mortgage backed securities are having the desired impact on real estate inflation.
The problem is we still have a shortage of housing, so, money can't stay too tight for too long, because we need to redevelop a lot of empty offices to condos and build more houses.
A deeper real estate correction through summer, followed by cheaper money, would be just the ticket to spur the next wave of housing development.
There's a lot of moving parts that need to come mostly together for the Fed to loosen up. I'll set the over/under on an extended period of loosening financial conditions at Labor Day. I'll take the under, but not by much. Just in time for the Presidential Cycle bull market.
Closing Investment Thoughts
I have been covering what is in this article for 5 quarters now. We are closer to the end of the negative trends than the beginning. But, there is clearly the potential for a few more problems.
What if OPEC tightens up oil supplies by choice or war?
What if China backtracks on reopening after COVID Zero and mucks up supply chains again?
What if Repo markets break badly sooner?
What if there are alien black swans?
There is always a negative scenario that could hit. I have been calling it the Armageddon Zombie Apocalypse scenario.
Macro Dashes: The 'Armageddon Zombie Apocalypse' Is In Play
That is not my base case. My base case is the stock market round trip in 2023. But, if OPEC and China want to play rough with President Biden again, then who knows what will come into play?
Right now, I think it is far more likely that we get a little Kumbaya by late summer or autumn, and that leads to a large Presidential Cycle stock market rally.
In fact, and I'll cover this in other articles, I think the U.S. and Emerging Markets are setting up for a decade long bull market.
Right now, we all have to maintain our asset allocations for each of our own risk tolerances. I suggest not too extreme in either direction.
We were well known to be heavy in cash at the start of 2022. By October 2022, I was repeatedly telling folks to slowly scale back into favored stocks and sectors. Our biggest pick was an overweight to emerging markets.

Bottom Tick Buy Alert EMQQ
If the dollar has another rally before starting to fade, that would be a great time to buy the dips on emerging markets where about three-quarters of global growth will happen in the next decade.
I also like small cap stocks that will lead U.S. growth, which have been decimated, but that is a stock by stock approach, not ETFs in my opinion. Small caps have already started to lead, but are in "buy the dips" spaces across our dozen favorites.
Finally, in my opinion, Tech is still King. Especially tech tied to 4th Industrial Revolution industries and those with recurring software-as-a-service revenue (like the past 20 years). I will be looking for an entry on the Invesco QQQ ETF (QQQ) at some point in the next 6 months or so.
More By This Author:
Fed Watch: It's The QT Stupid
2023 Futile Forecasts & Special Reports
Getting Ready For The Coming Stock Market Elevator Drop


Comments
Log in or sign up to join the conversation.