
In retail, employees are often told that the consumer is always right. While this isn’t always true, it is a reminder that patient customer service usually wins the day.
In investing, it also appears that the consumer is always right. But it depends on which consumer.
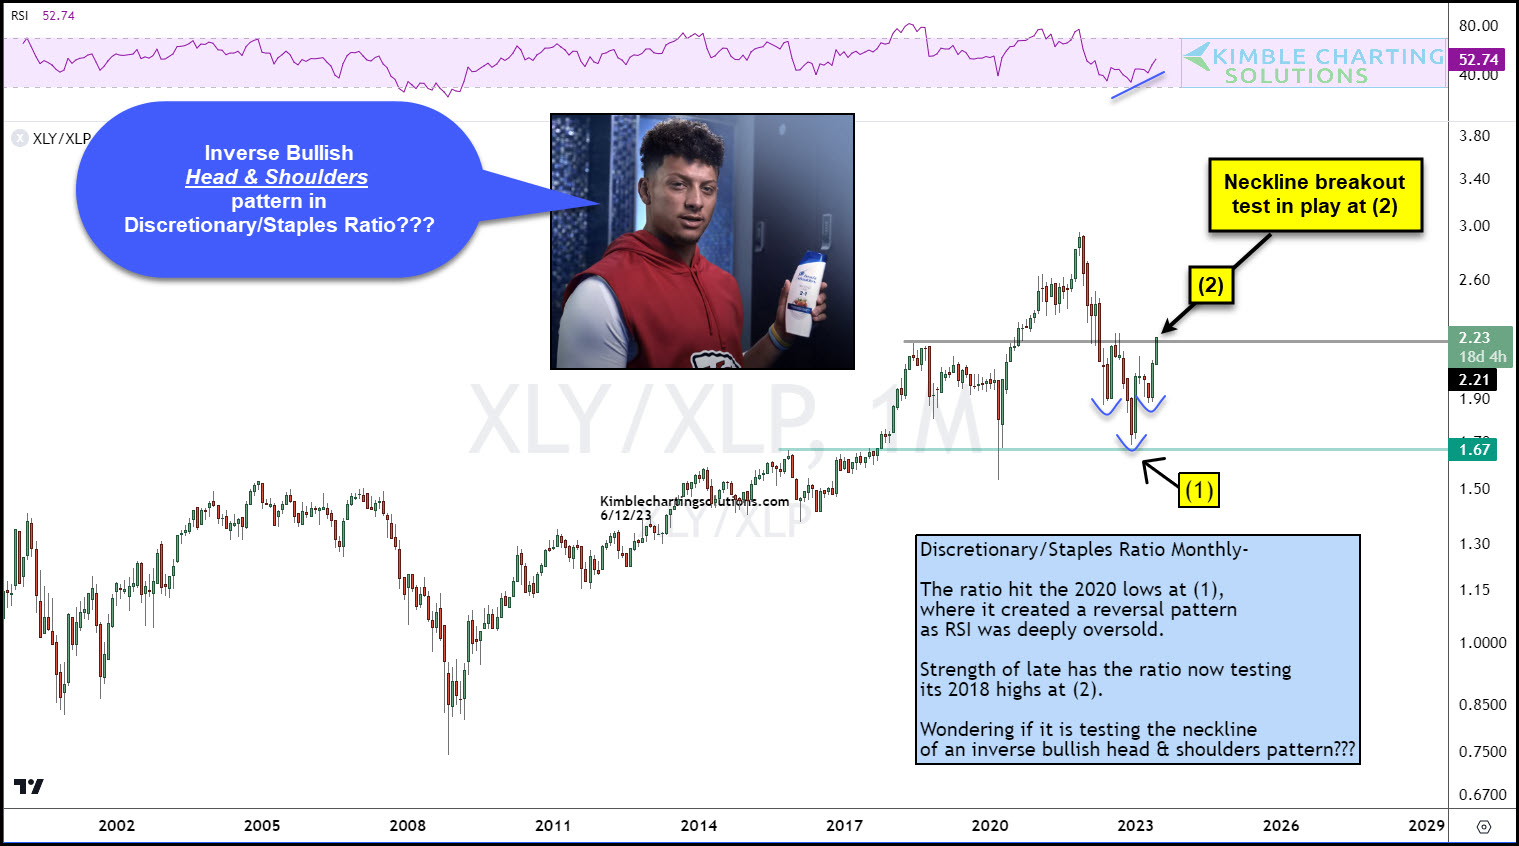
In today’s chart, we highlight a key consumer ratio over a long-term “monthly” timeframe: the Consumer Discretionary ETF (XLY) to the Consumer Staples ETF (XLP).
Since Discretionary represents bullish “additional” spending and staples represent bearish “essential” spending, it is important for bulls to see this ratio heading HIGHER.
Looking at the chart, we can see that the XLY/XLP ratio formed a low near the 2020 low at (1) and is showing strength while testing the 2018 and 2022 highs at (2). The price action has formed a bullish inverse head & shoulders pattern that is testing resistance at the neckline.
This appears to be a big test for the XLY/XLP ratio at (2). A breakout here would be HUGE for stock market bulls.
(Click on image to enlarge)
More By This Author:
Junk Bonds “Pennant Pattern” Nears Critical Point For Investors
Gold Bulls Would Love USD Weakness Here
Nasdaq Composite Ratio Reaches Counter-Trend Resistance Area


Comments
Log in or sign up to join the conversation.