

Image Source: Pexels
Successful traders and investors tend to watch junk bonds performance to understand when the financial market is bullish (junk bonds do well) versus when the market is bearish (junk bonds don’t do well).
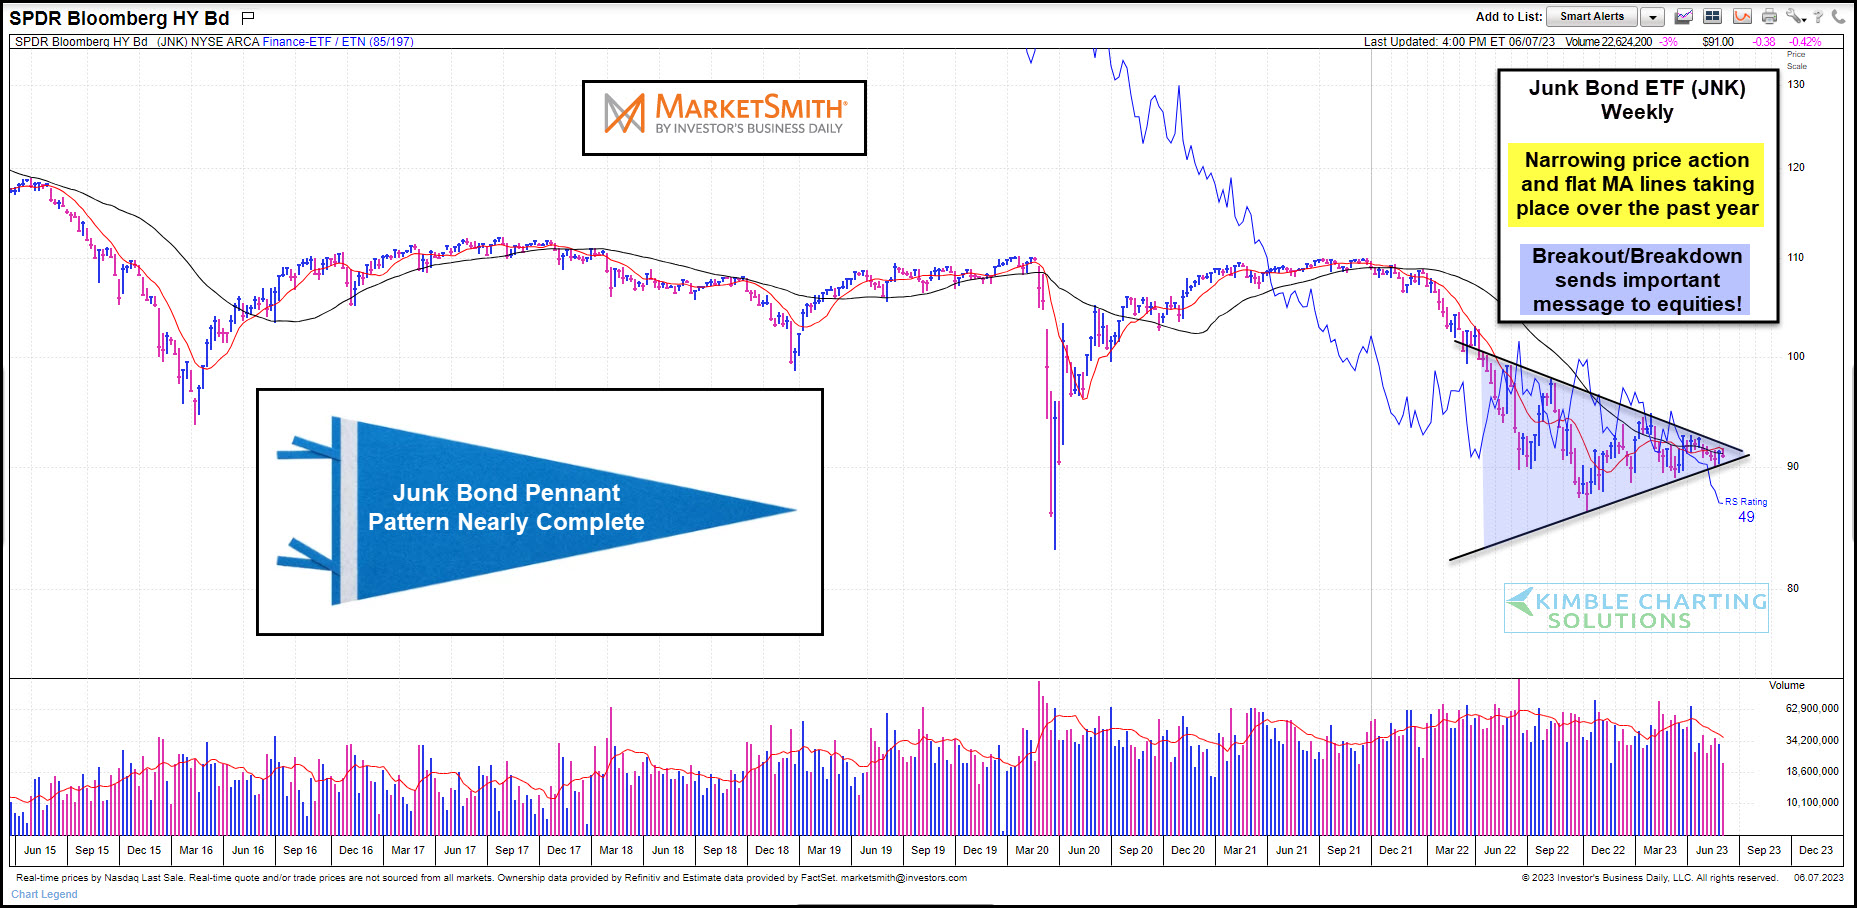
Today’s chart was created at Marketsmith.com
Looking at today’s intermediate-term “weekly” chart of Junk Bonds (JNK), it’s apparent that junk bonds have not performed as well as bulls hoped for. And this correlates to the stock market’s counter-trend rally… which has fallen well short of its highs.
That said, nothing has been decided. And when we look at junk bonds, we see a narrowing pennant pattern that is likely to resolve soon. This pattern has developed over the past year and continues to narrow. Something has gotta give soon!
And this means investors should continue to follow this ETF until the pattern resolves. The resolution to this compression pattern will send an important message to U.S. equities and global stock markets!
Should Junk Bonds breakout to the upside, they send a positive message to stocks!
(Click on image to enlarge)
More By This Author:
Gold Bulls Would Love USD Weakness Here
Nasdaq Composite Ratio Reaches Counter-Trend Resistance Area
Treasury Bonds ETF (TLT) Trading At Key Decision Point


Comments
Log in or sign up to join the conversation.