

Recently we have focused on the Russell 2000 (IWM) small-cap index. Since the index shows a large variety of companies, it gives a great picture of where the overall market is trading and where it could go next. With that said, paired with our indicators, IWM gives us an edge when timing entries into trades.
As seen in the chart above, IWM has come off in price and broken its 50-day moving average. Currently, IWM is in a bearish phase since the 50-DMA (blue line) is trading under the 200-DMA (green line), with the price under the 50-DMA.
With that said, we should be careful not to look at IWM from a completely bearish standpoint. Though it is technically bearish, the index is stuck within a trading range. This can also be seen in the chart, with the lines indicating the general top and bottom of the range.
Because we are in the middle of the range, not only is this a tough area to trade, but it is also a more volatile zone. Therefore, we should wait to take trades that are weak, such as near the bottom of the range, or to look for shorting opportunities near the top of the range. We can also look for breakouts and breakdowns in these pivotal areas.
When looking at our indicators, Real Motion (red dotted line) is breaking underneath the 50-DMA, showing that price along with momentum is failing. We can also see the Leadership indicator continues to trend lower under the red line, showing overall weakness when compared to the S&P 500 (SPY). This only confirms we need to be cautious when looking for any upside potential in IWM at this point.
So how, does this help us? With an overall weak market, this is the perfect time to look for trading ideas that are countering the trend or stabilizing as the market moves lower.
When a turnaround situation does happen, these are the symbols to focus on. One example of a symbol that has been outperforming even while the market has taken a downward turn is the Invesco Agricultural ETF (DBA).
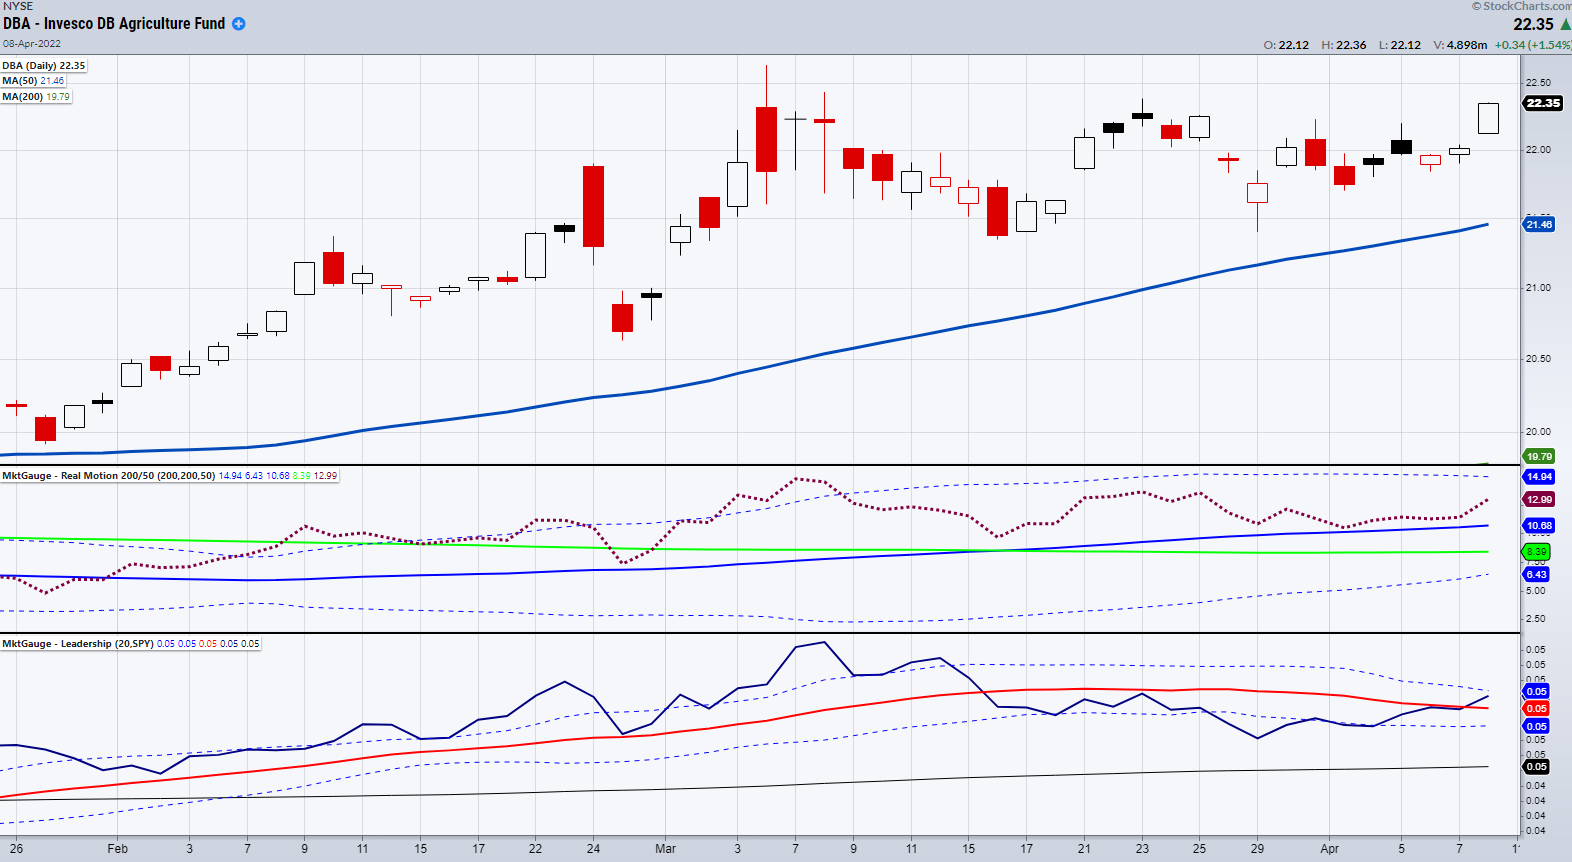
On Friday, DBA broke out from a small consolidation area. It is also showing positive momentum on Real Motion and outperformance on the Leadership indicator.
Moreover, the idea is to keep the big picture of IWM in mind from a range trading standpoint, and to look for symbols that are showing strength or consolidating without breaking lower.
ETF Summary
- S&P 500: Watching for a move back over the 200-DMA or a break under the 50-DMA, as each are very close.
- Russell 2000: In a pivotal area. Could easily break down towards the bottom of the range near the 187 level.
- Dow: 343 is the level it needs to hold.
- Nasdaq (QQQ): Could not hold the 50-DMA at 349.52.
- Regional banks (KRE): Inside day.
- Semiconductors (SMH): 237 may be the next main support.
- Transportation (IYT): Needs to find support or get back over 243.
- Biotechnology (IBB): 128 may serve as support.
- Retail (XRT): 72 is the level to hold.
- Gold (GLD): 181.50 is the level to clear and hold.
- Oil (USO): 70 is the level of support.
- Agriculture: Cleared the 22.20 level.


Comments
Log in or sign up to join the conversation.