
How many of you have heard me say that commodities are inherently volatile?
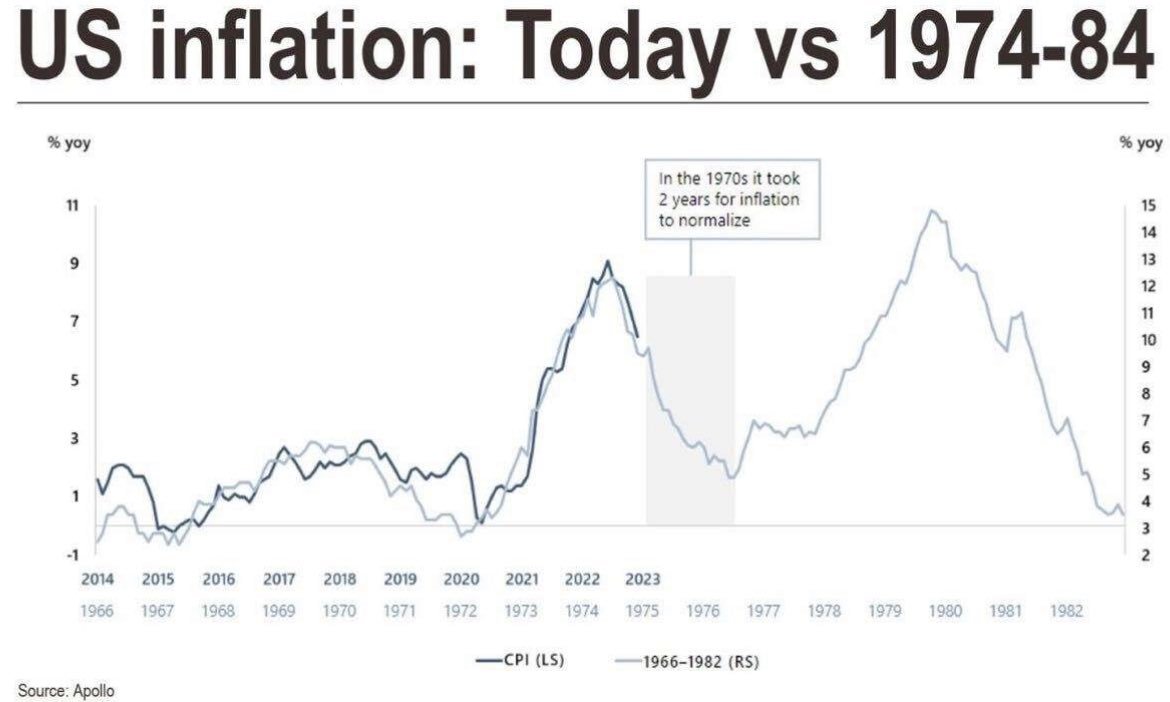
Clearly, from this chart, you can see that after the oil rally in the mid-1970s, the CPI went from nearly 9% in 1974 down to 2% in 1976.
Sugar, my favorite barometer of inflation, ran to $.66 a pound in 1974, and then down to around $.08 cents a pound in 1976. Huge.
As sugar peaked, inflation as measured by CPI had a stupendous drop within 2 years.
Similarly, the CPI peaked in June 2022 at around 9% and here we are with CPI currently at 3.6%.
If the timeline matches, we could see inflation decline further into 2024.
However, everything moves a lot faster now.
So, let’s assume that history rhymes rather than repeats.
If that is the case, inflation is due for another run, even if oil calms down from current levels.
After the trough in inflation in 1976, it took four years for the next peak to hit. In 1980, CPI reached nearly 15%.
Sugar ran from $.08 back up to around $.45 a pound by 1980.
At present, if we reduce the timeframes, after 1.5 years of declining inflation, maybe we see another 2-3 years of climbing inflation.
Does inflation peak in 2024-2025?
Maybe a bit frightening to worry about much higher inflation, nonetheless, we look for opportunities to make money.
Last week we wrote about gold miners.
Today, September 18th, GDX the ETF for gold miners cleared the 50-DMA for a second consecutive time and went into a confirmed recuperation phase.
And that’s before the Fed meeting.
We also mentioned that miners often lead the precious metals markets.
And all heading higher means more inflation concerns.
(Click on image to enlarge)

3 technical indicators to note, and all in line with the IBD interview featured over the weekend.
Calendar Ranges-GDX held the July 6-month calendar range low (red line). We consider that a reversal.
There is still quite a distance to the July 6-month calendar range high (green line).
Phases-GDX has 2 closes over the 50-DMA, which has a slightly negative slope. However, the phase has improved to Recuperation.
Additionally, Real Motion (momentum) shows some resistance at the 50-DMA (blue line). Hence, we need more momentum.
Leadership-GDX now convincingly outperforms the SPY. That too, however, needs a boost over the dotted Bollinger Band resistance.
Keep your eyes on the August 30th high at 30.00.
Education only-trading comes with risk.
More By This Author:
Fresh Look At Long BondsFinding And Trading Instrument Bottoms
TEVA - A Pharma Stock To Watch


Comments
Log in or sign up to join the conversation.