

Image Source: Pixabay
In this article, you’ll see how the Russell 2000 has performed over the last 1, 3, 5, 10, and 20 years.
Over the last 20 years, the Russell 2000 has underperformed the S&P 500 returns and Nasdaq 100 returns by a significant margin.
Average returns can be deceiving because they hide the big up-and-down years that make up the average. Therefore, you’ll also learn what the biggest up and down years have been, in percentage terms.
There have been periods where the Russell 2000 has outperformed. Yet the data shows that the larger capitalization indices/ETFs are better choices for long-term investment performance.
The Russell 2000 is an index composed of US-based small capitalization stocks. It is the 2000 smallest capitalization stocks in the Russell 3000 index. The Russell 3000 is the largest 3000 companies in the US, so by extension, you could think of the Russell 2000 index as the 2000 smallest companies in the top 3000.
The Russell 2000 index was launched in 1984. The iShares Russell 2000 ETF (IWM), which tracks the Russell 2000 index, was launched in the year 2000.
Average Russell 2000 Returns Based on IWM
Here are the annualized returns for the Russell 2000 index for the last 20, 10, 5, 3, and 1 years. Statistics are based on the IWM ETF which has a 0.19% yearly expense ratio, so the actual index returns will be slightly higher (but you can’t invest in the index without incurring fees, so these are the returns you would have actually received).
| Years Averaged (as of Jan. 29, 2024) |
Russell 2000 Average Return Per Year (with dividends) |
Russell Average Return Per Year (no dividends) |
| 20 years | 7.71% | 6.31% |
| 10 years | 7.25% | 5.82% |
| 5 years | 7.47% | 6.06% |
| 3 years | -0.8% | -2% |
| 1 year | 6.36% | 4.82% |
Returns have been calculated based on TradingView charts.
Everyone should passively invest some funds. Set it and forget it for 10 years or more to compound your wealth.
The Passive Stock Investing Using ETFs eBook lays out how to do it, including how to capitalize on the long-term upward trajectory of index funds. Just a reminder that the S&P 500 and Nasdaq 100 have been better long-term performers than the Russell 2000.
Making 7.7% per year, which the Russell 2000 has averaged over the last 20 years, produces a $735,974 nest egg if investing $10K and adding $500 each month for 30 years. Invest $190,000 total, over 30 years, to make $736k. That’s the power of compounding.
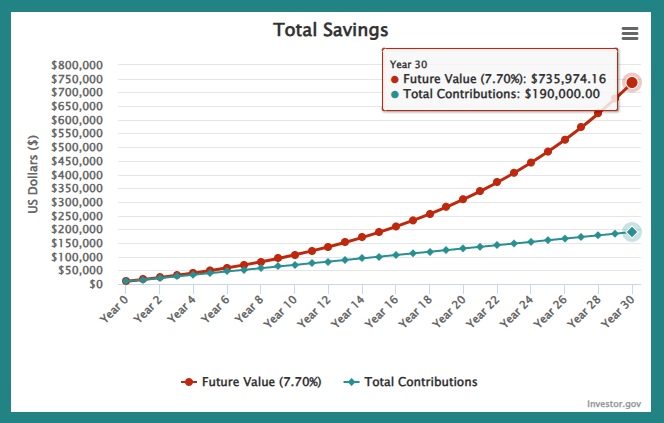
For reference, investing in the S&P 500 with its higher average yearly return of 10.5% would produce a $1.285 million nest egg.
That’s passively investing, not trading, and just adding a bit more to the position each month. You can use the investment calculator on Investor.gov to test out different scenarios. Note that returns may be higher or lower in the future.
The Biggest Up and Down Years for the Russell 2000
Many of the biggest up and down years occurred around the tech bubble of 2000, as well as the financial crisis of 2008. Returns include dividends.
Dates and returns prior to 2001 are based on the Russell 2000 index and not IWM (and thus don’t include dividends).
Biggest Russell 2000 Index Down Years
2008: -34.15%
1990: -21.46%
2022: -20.48%
2002: -20.37%
2018: -11.11%
Biggest Russell 2000 Index Up Years
2003: 47.58%
1991: 43.68%
2013: 38.69%
2009: 28.51%
2010: 26.93%
1995: 26.21%
2019: 25.39%
1988: 22.38%
2016: 21.6%
1997: 20.52%
2020: 20.03%
Russell 2000 Returns by Year
The following are the Russell 2000 returns by year based on the IWM ETF.
2024 (so far): -1.24%
2023: 16.83%
2022: -20.48%
2021: 14.54%
2020: 20.03%
2019: 25.39%
2018: -11.12%
2017: 14.58%
2016: 21.59%
2015: -4.48%
2014: 5.04%
2013: 38.7%
2012: 16.7%
2011: -4.43%
2010: 26.92%
2009: 28.49%
2008: -34.16%
2007: -1.76%
2006: 18.27%
2005: 4.23%
2004: 17.46%
2003: 46.87%
2002: -20.85%
2001: 1.2%
The Russell 2000 returns below, for the year 2000 and prior, are based on the Russell 2000 index and thus don’t account for dividends.
2000: -4.2%
1999: 19.6%
1998: -3.5%
1997: 20.5%
1996: 14.8%
1995: 26.2%
1994: -3.2%
1993: 17%
1992: 16.4%
1991: 43.7%
1990: -21.5%
1989: 14.2%
1988: 22.38%
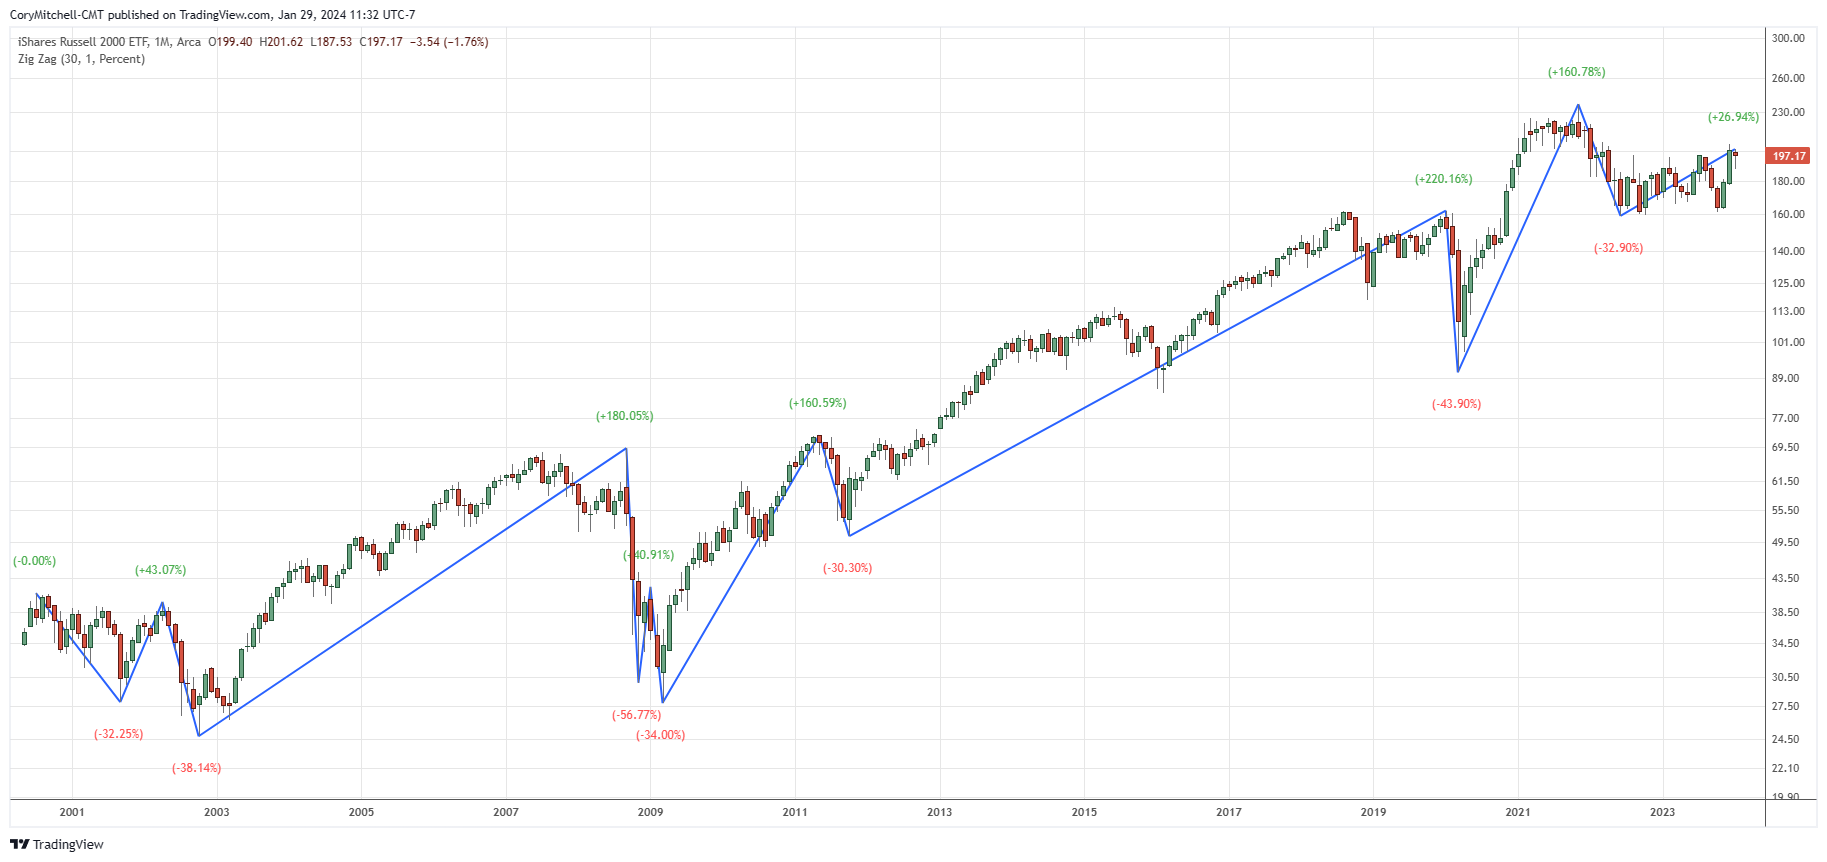
Russell 2000 Historical Chart with Rally and Decline Percentages
The Russell 2000 ETF (IWM) began trading in 2000. The following chart shows the journey the index/ETF has taken since, including rallies and declines of more than 30% (peak to trough) over that time.
The chart is based on monthly data points. If using a shorter time frame, such as daily, there are many more 30% drops and rallies, but this chart shows the overall moves and their ultimate percentages.
The chart is logarithmic.
(Click on image to enlarge)
Lowest Fee Russell 2000 ETFs
The easiest way to invest in the Russell 2000 is to use an exchange-traded fund (ETF). You buy and sell it like an individual stock, and the managers of the ETF make sure the fund tracks the index by buying the same stocks that are included in the Russell 2000.
iShares Russell 2000 ETF (IWM)– a popular choice with the highest average daily volume of Russell 2000 ETFs and a 0.19% expense ratio per year.
Vanguard Russell 2000 Index Fund (VTWO) – A lower fee option for longer-term investors. VTWO does about 10% of the daily volume of IWM, which is still ample volume, and has a 0.1% expense ratio. It has performed just a tiny bit better over the long term than IWM because of the lower expense ratio.
An expense ratio is the cost of managing the fund, or your cost of investing in it. So if the Russell 2000 returned 10% in a year, with a 0.2% expense ratio, your return as an investor would be 9.8%.
For Canadian investors looking to invest in the Russell 2000 via a Canadian ETF (that you buy in Canadian dollars), the iShares US Small Cap ETF CAD-Hedged (TSX: XSU) is a solid choice. It hedges the US dollar exposure, so the return is more similar to the Russell 2000 (which is priced in US dollars) since currency fluctuations have less effect on the overall return. It has a 0.35% expense ratio.
The iShares S&P 500 US Small Cap Index ETF (TSX: XSMC) is priced in Canadian dollars and is unhedged to the US-dollar-denominated Russell 2000 index. Its returns are the Russell 2000 plus/minus the change in the USD/CAD currency rate. It has low volume and a 0.2% management fee.
More By This Author:
Statistics On How Bitcoin MovesBest Performing Stocks In January Over The Last Two Decades (75%+ Win Rate)
Tailor Strategies to Emotions and Skill Level for Maximized Earnings and Rapid Improvement


Comments
Log in or sign up to join the conversation.