
Friday Continues The Short-Term Downtrend
The market tried to bottom out and rally a couple times this past week, but it just couldn't find its footing. So the short-term downtrend continues.
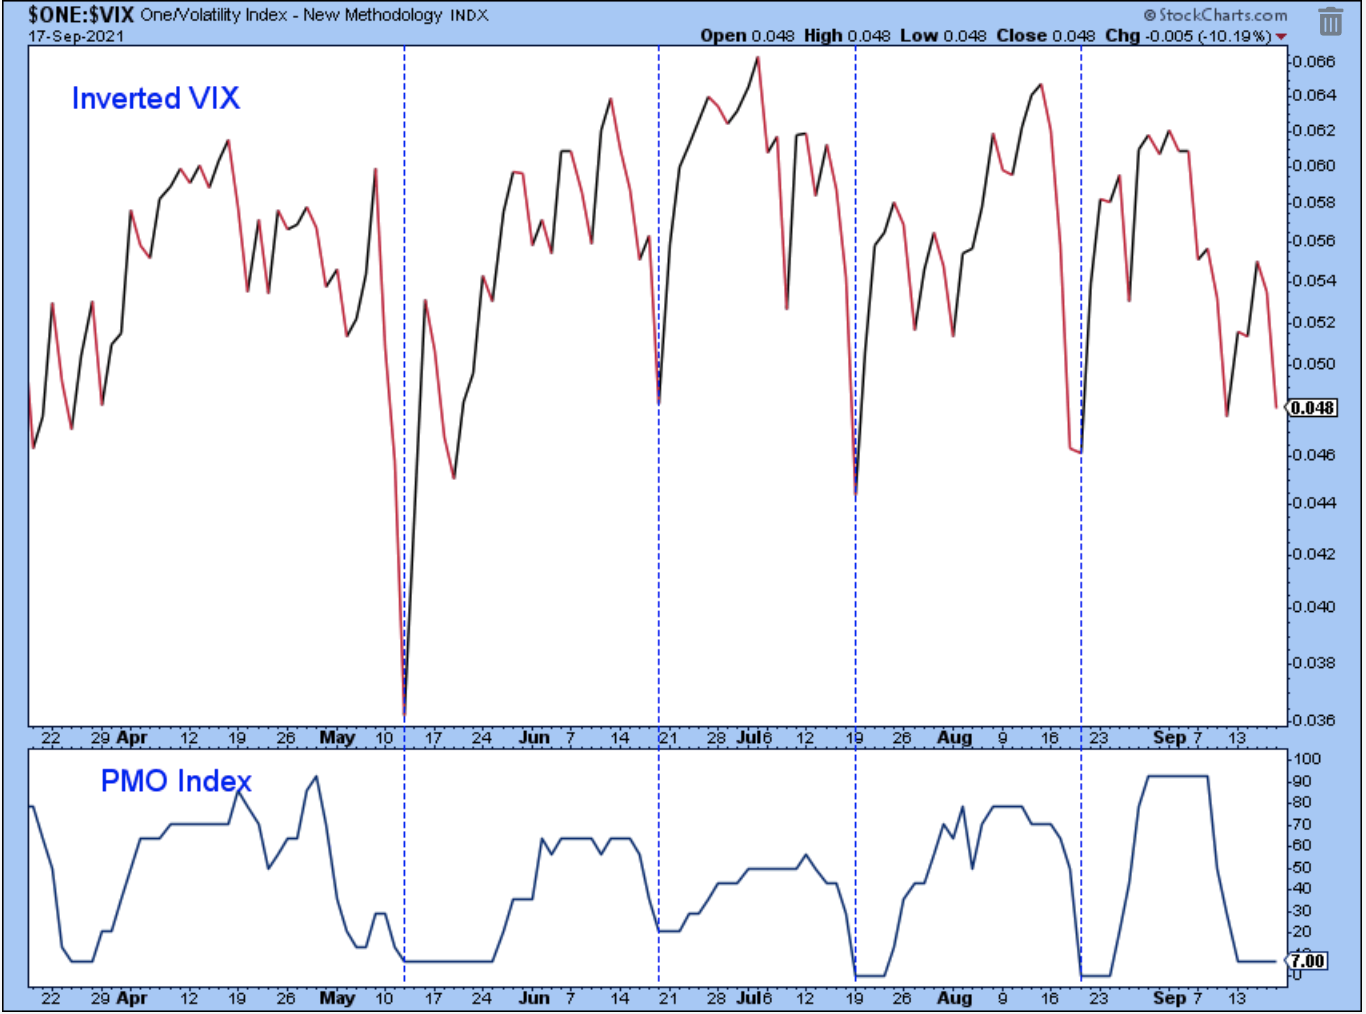
The PMO hasn't reached an extreme low, meaning that there are still some stocks showing strength. The question is, does the market need to break down the remaining stocks before it is ready to move higher? I don't know the answer, but there is enough risk that the market needs another leg lower and I will probably avoid any more purchases until the PMO index shows a white candle on this chart.

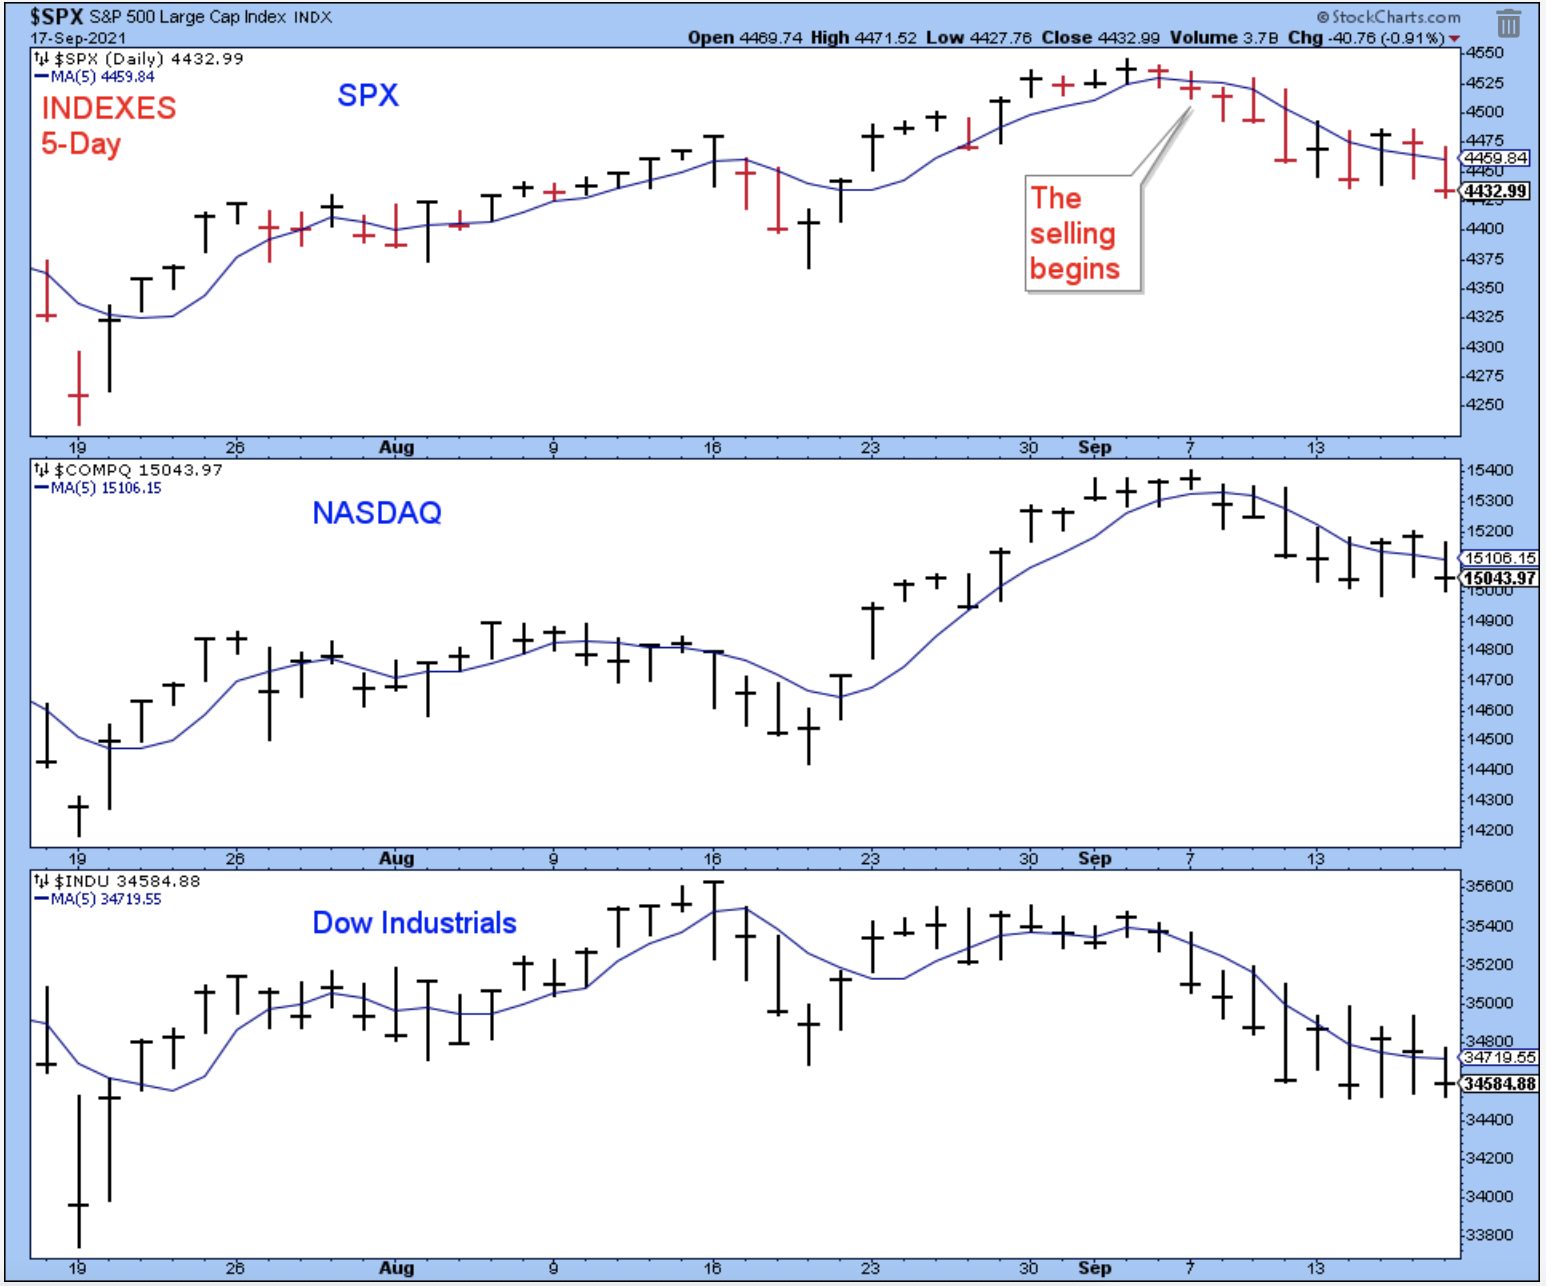
In order for a new uptrend to begin, the major indexes have to close above their 5-day averages. On Wednesday and Thursday, the indexes closed above their 5-days and it looked like we might get an uptrend. We just needed to see some upside follow-through on Friday to declare a new uptrend. But Friday was a disappointment, and now we continue to wait for a signal that the market is ready to move higher.
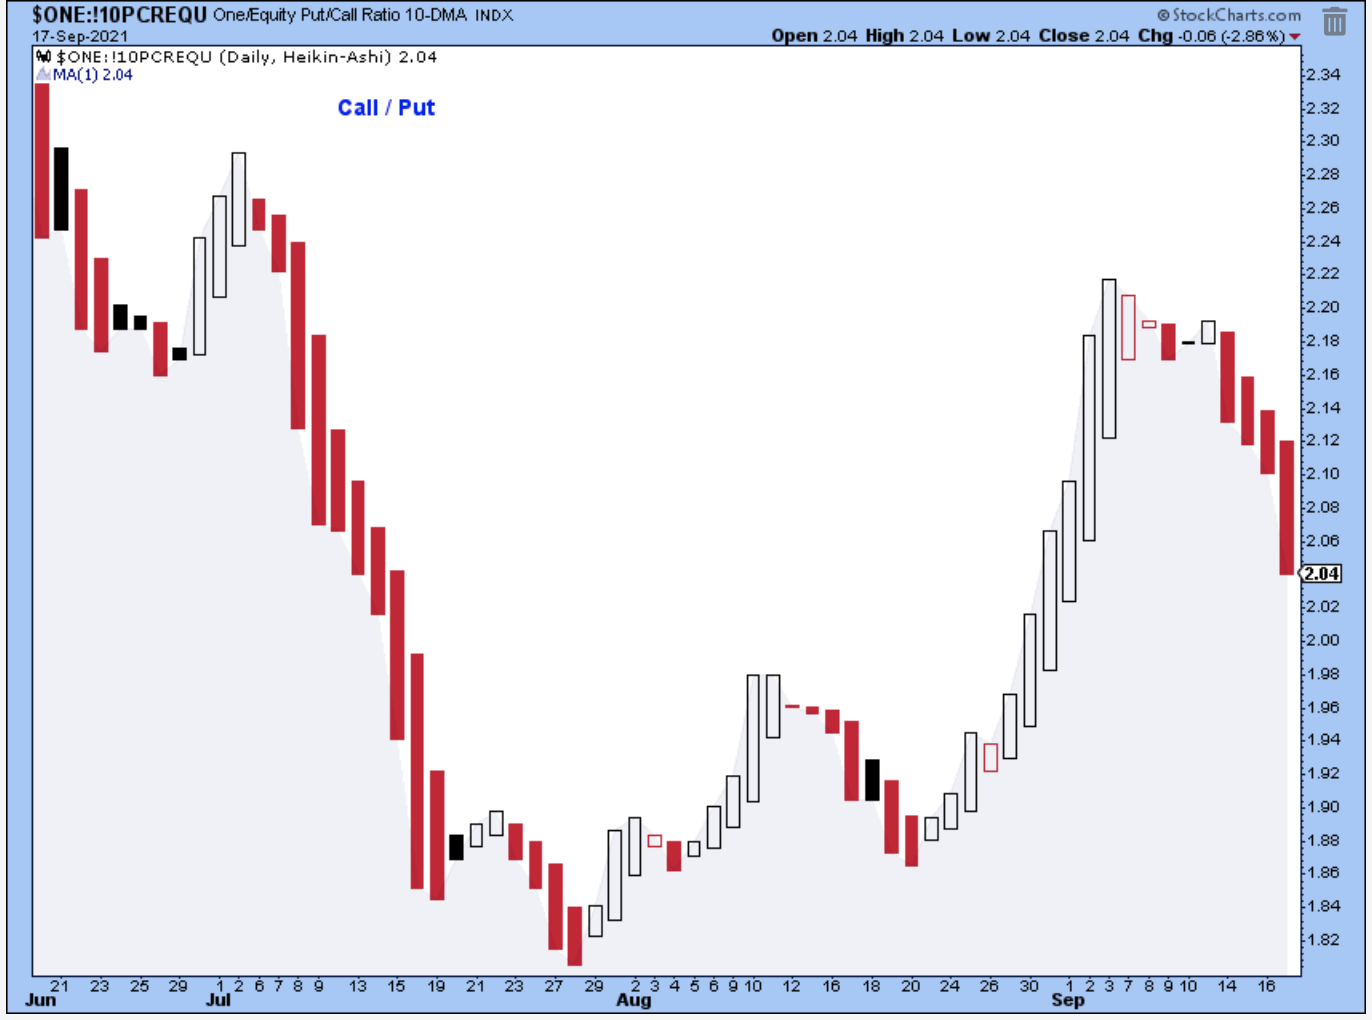
The 10-day Call/Put is certainly not suggesting a new uptrend. This indicator has been pointing decisively lower and it did head lower all week despite the promising price action on Wednesday and Thursday. Bearish.
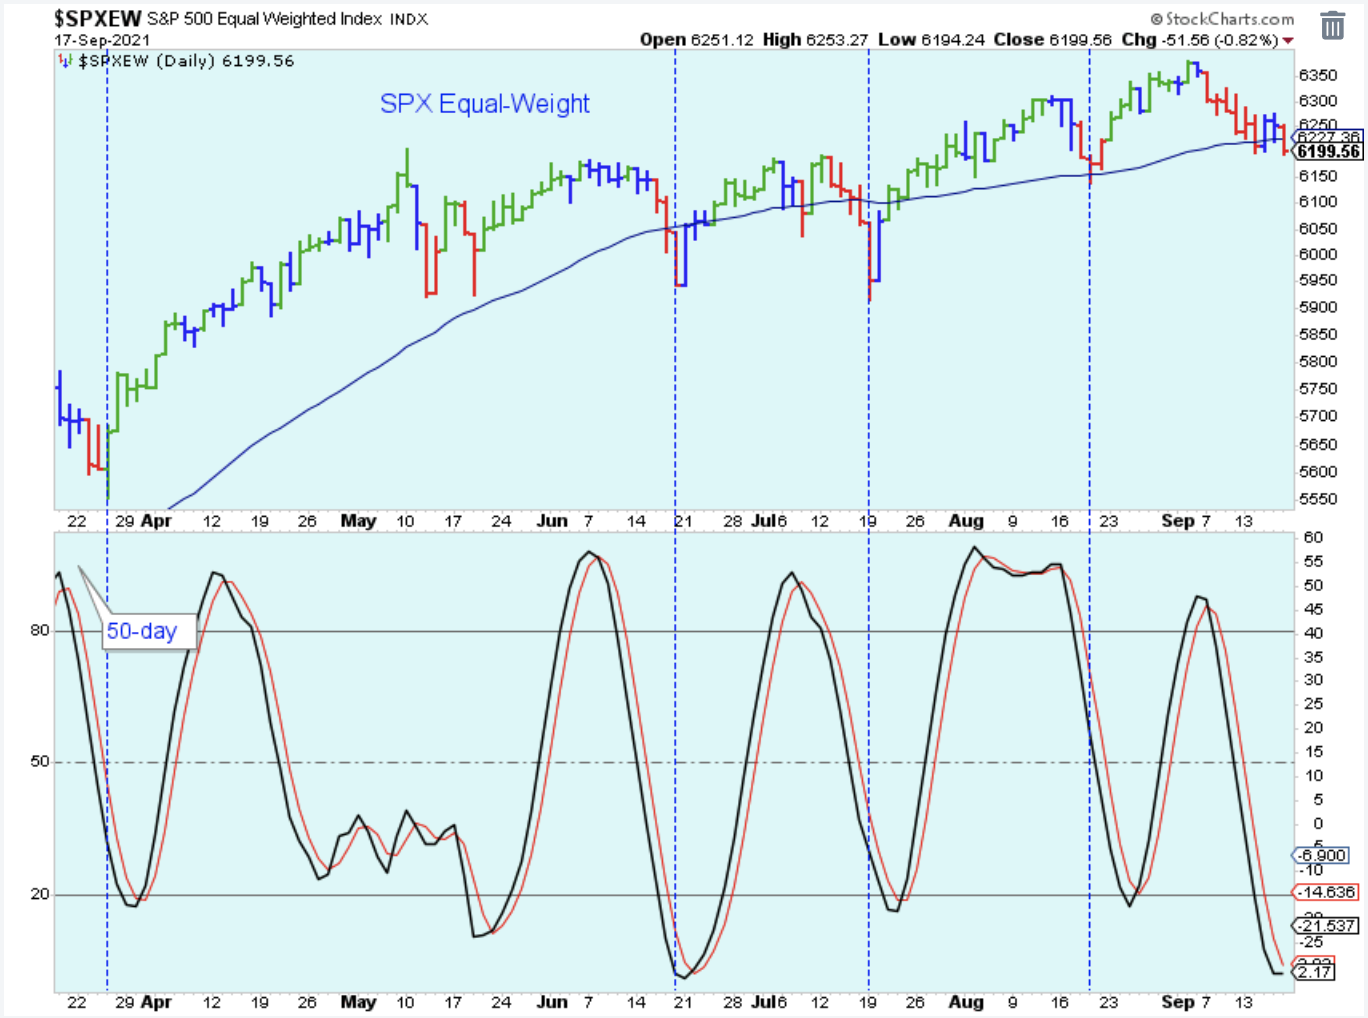
The SPX equal-weight closed just below its 50-day. This index doesn't look too bad, but it is important that it holds above the August low. Otherwise, the possibility of a larger correction will be in play.
The stochastic is well into oversold territory, and it looks like it wants to turn higher. When the stochastic looks like this, it is usually time to look for signs of the next short-term uptrend while also being open to the possibility that the market could break down.
With the PMO near the low of its range, I'm on the lookout for a negative spike in the inverted VIX as a sign that the selling is done. I thought the negative spike occurred a few days ago, but the inverted VIX retested the level on Friday.
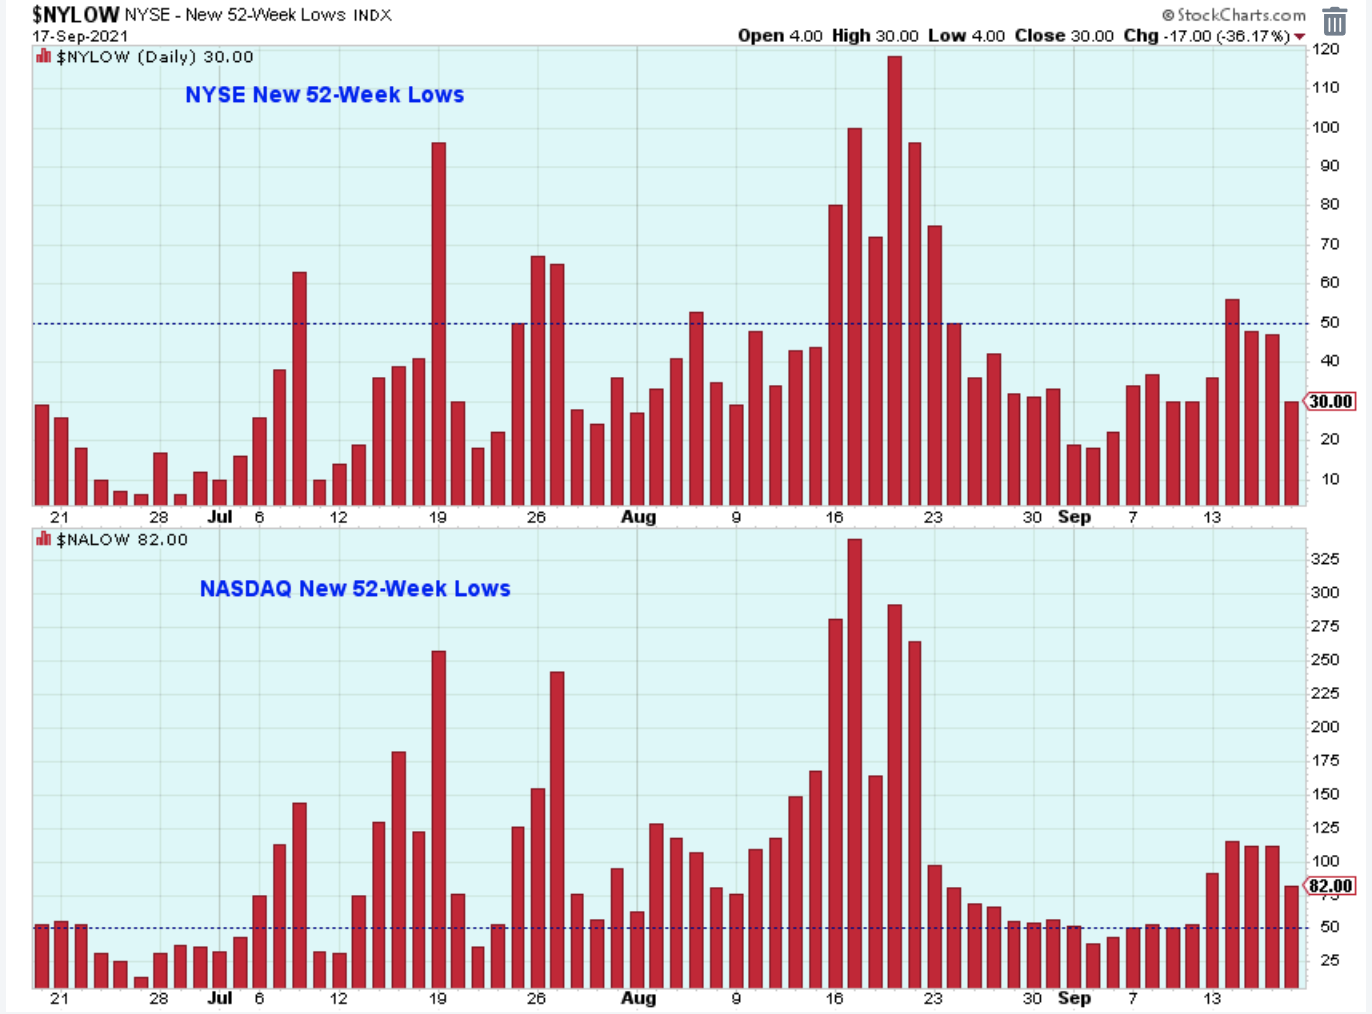
The market had a rough day on Friday, but the number of new 52-week lows decreased nicely on both exchanges. This is a good sign. If the number of new lows had increased significantly on Friday, I would have been taking defensive measures. Instead, I just let the market stop me out of a few positions and left it at that. I am a bit nervous, though.
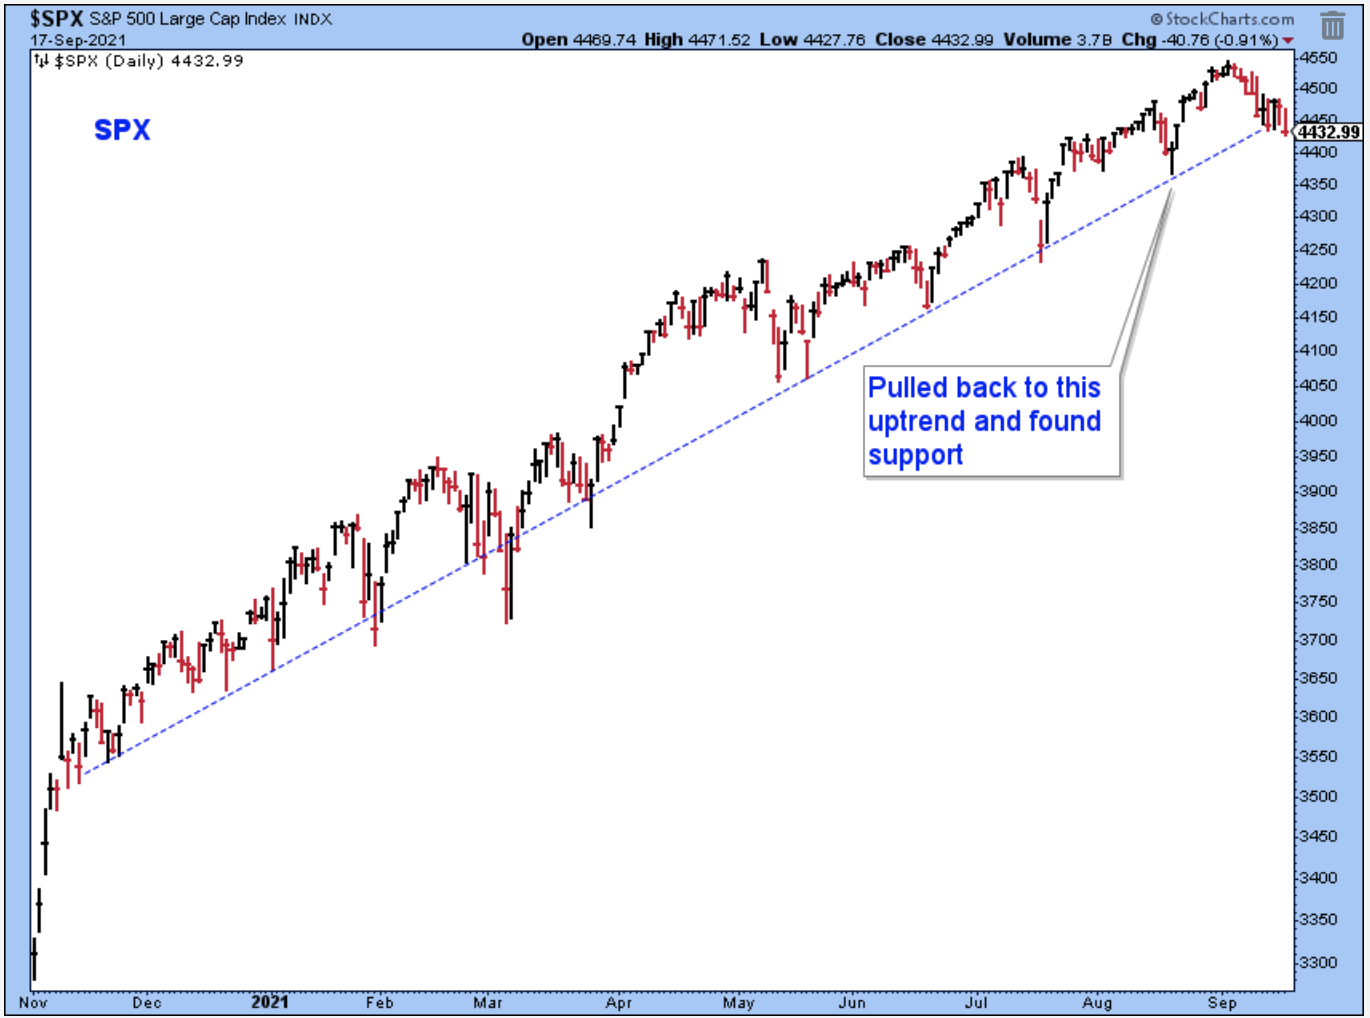
The SPX uptrend was broken slightly, although it depends on how you draw the trendline. A break of the trend is alright as long as the market turns around quickly and pushes back up above the line. The type of break-down and sharp-reversal shown in March can also be a very bullish whipsaw, and I wouldn't rule this out. For now, though, take this low tick as a warning sign.
There are a few ETFs that I monitor to evaluate market health. I like to monitor ARKK, FFTY, JNK, and IPO, among others.
The IPO ETF is shown below and it is pushing towards new highs. If the market is going to break down, it will take this ETF with it. So right now, I would say this is a bullish indication for stocks. However, watch this ETF during the trading day on Monday to see if it holds up. Also, it can turn lower very quickly as the red bars illustrated just a few days ago. If this ETF breaks below the Thursday low, I will be considering defensive measures.

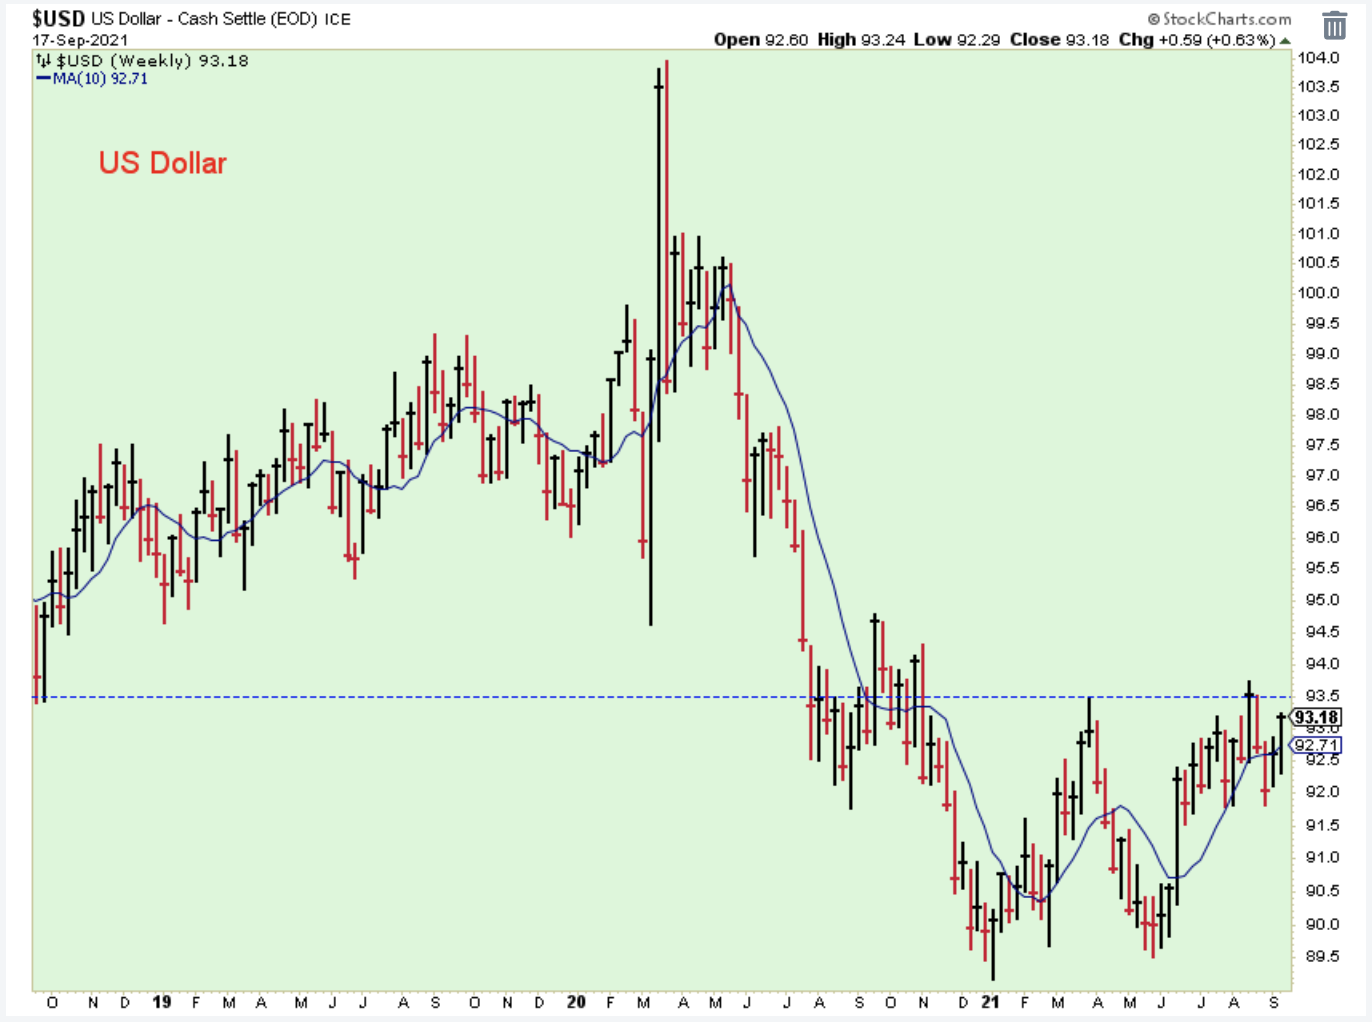
I'm watching the US dollar carefully. I think of a strong US dollar as being very helpful to US stock prices. On the other hand, a weak dollar tells me to consider purchasing emerging market and commodity-related stocks. At the moment, the weekly chart pattern looks like it really wants to break out into a new uptrend.
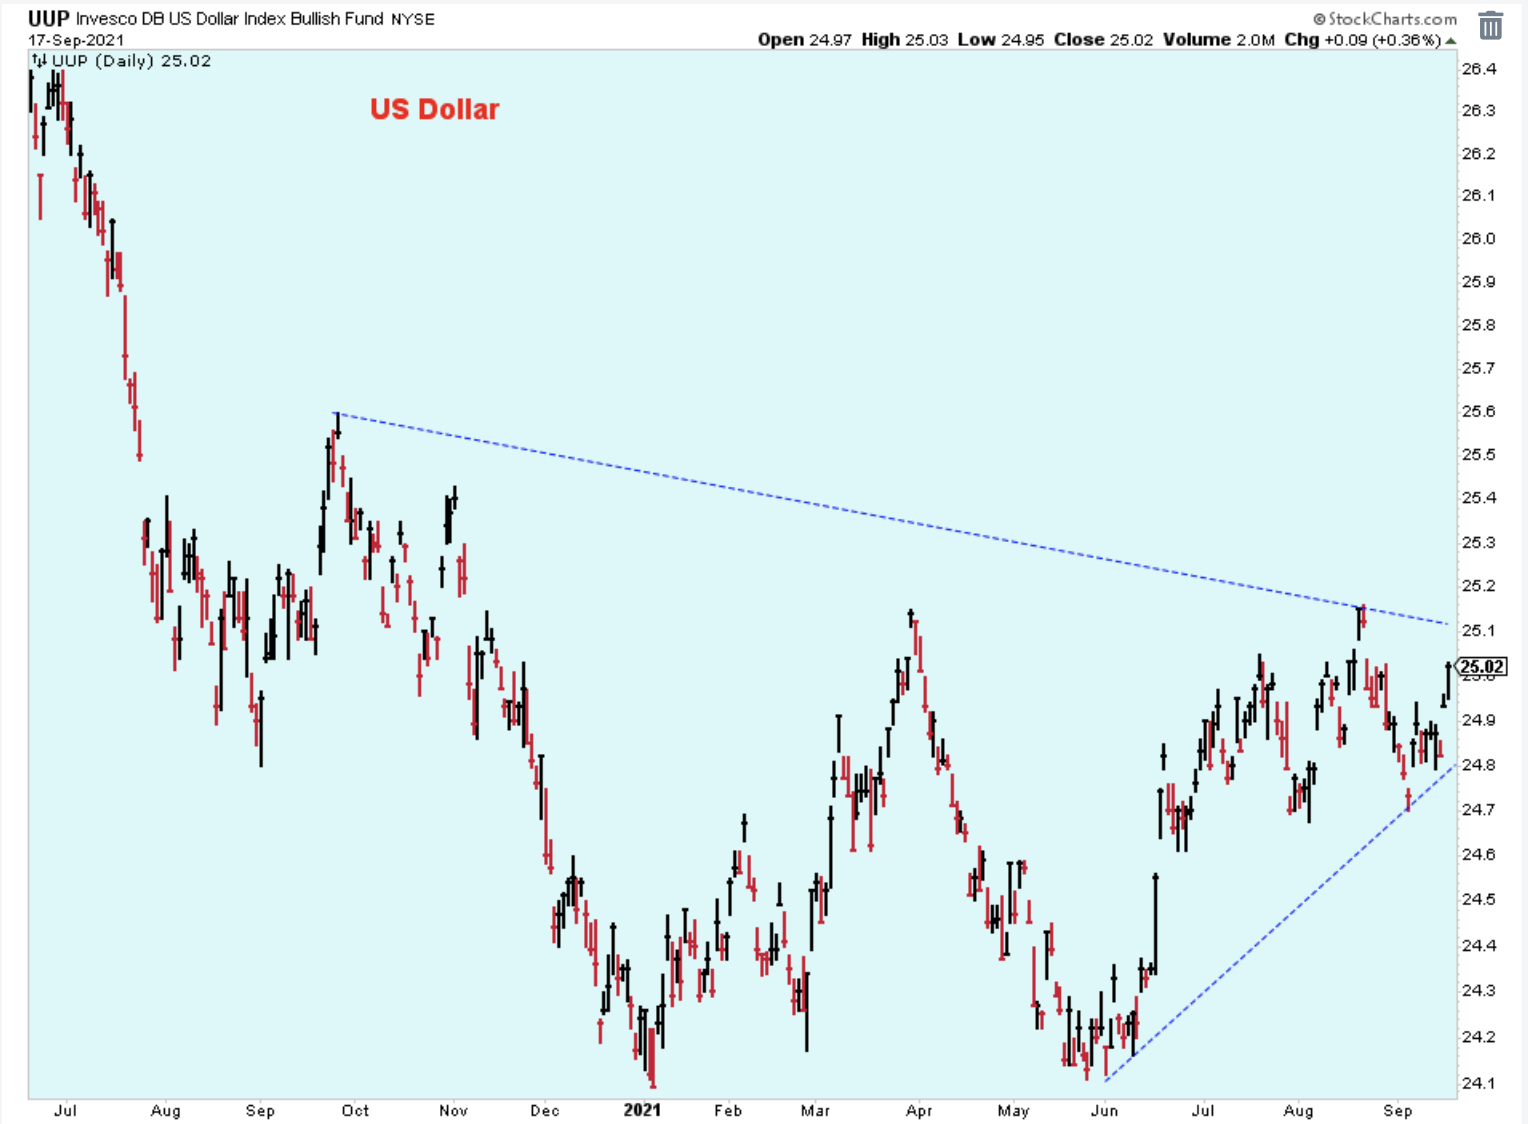
Here is a closer look using the daily chart. If this were the chart of a stock, I'd be getting ready to buy.
Some commodities and related stocks were hit hard on Friday, probably at least partly due to the strong dollar.
I heard on the news that some of the steel industry leaders commented on an improving outlook for steel products, but then I also heard that China reported slowing growth and that this would dampen demand for steel. Using the news to help trade has never worked for me, and this is one of the better examples of why. This is not the look of a chart in an industry that I would want to own.

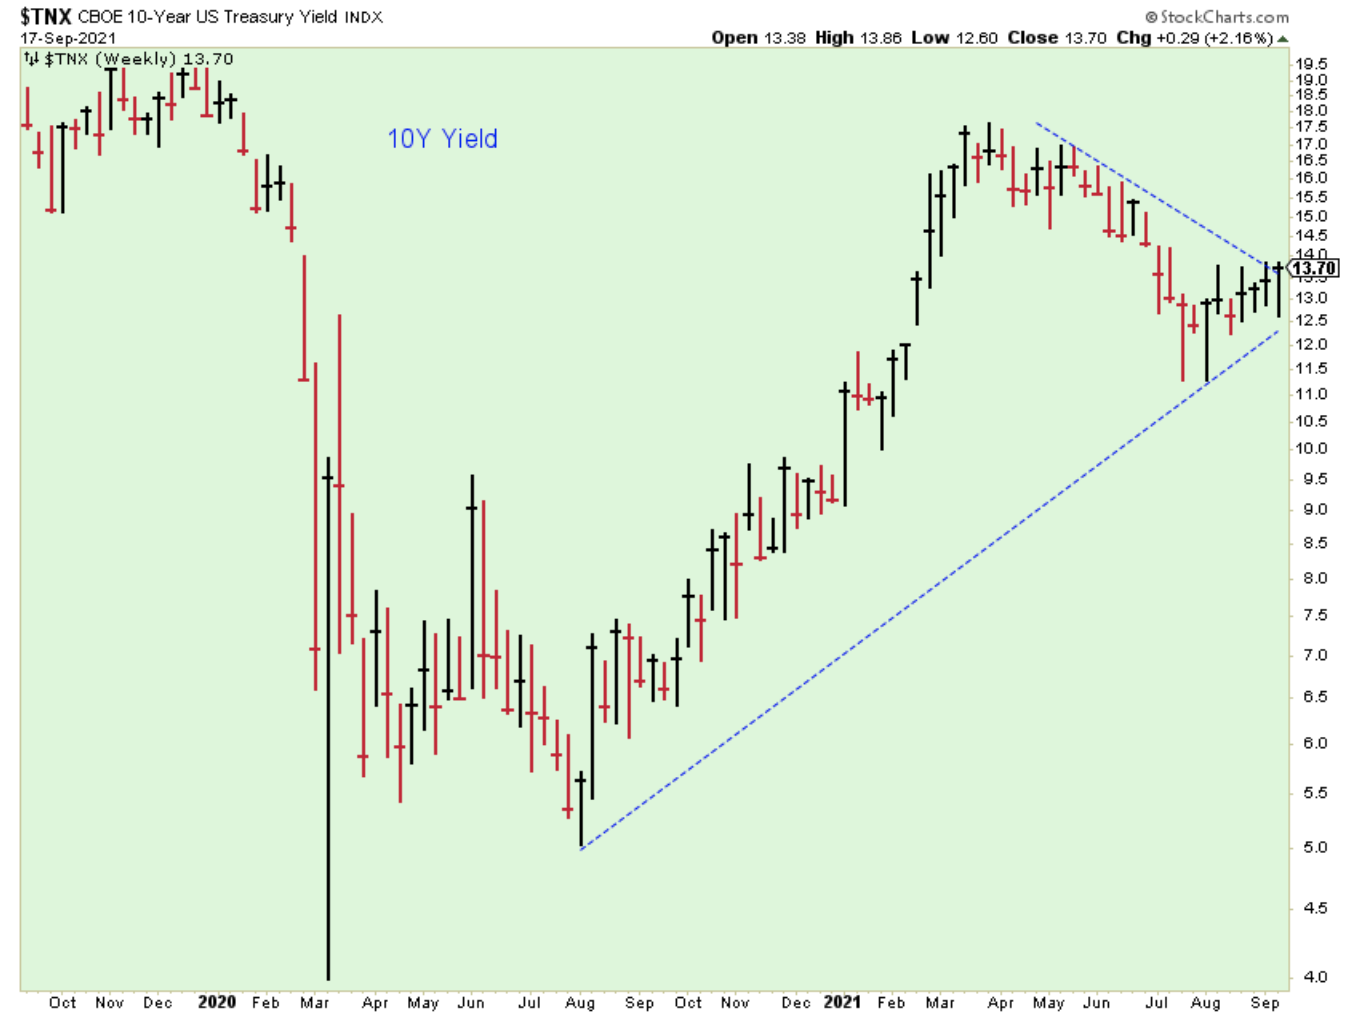
The direction of yields has been difficult to predict lately, similar to the US dollar. At the moment, the 10-year yield looks like it is headed higher again, but it has work to do before the trend is convincing.
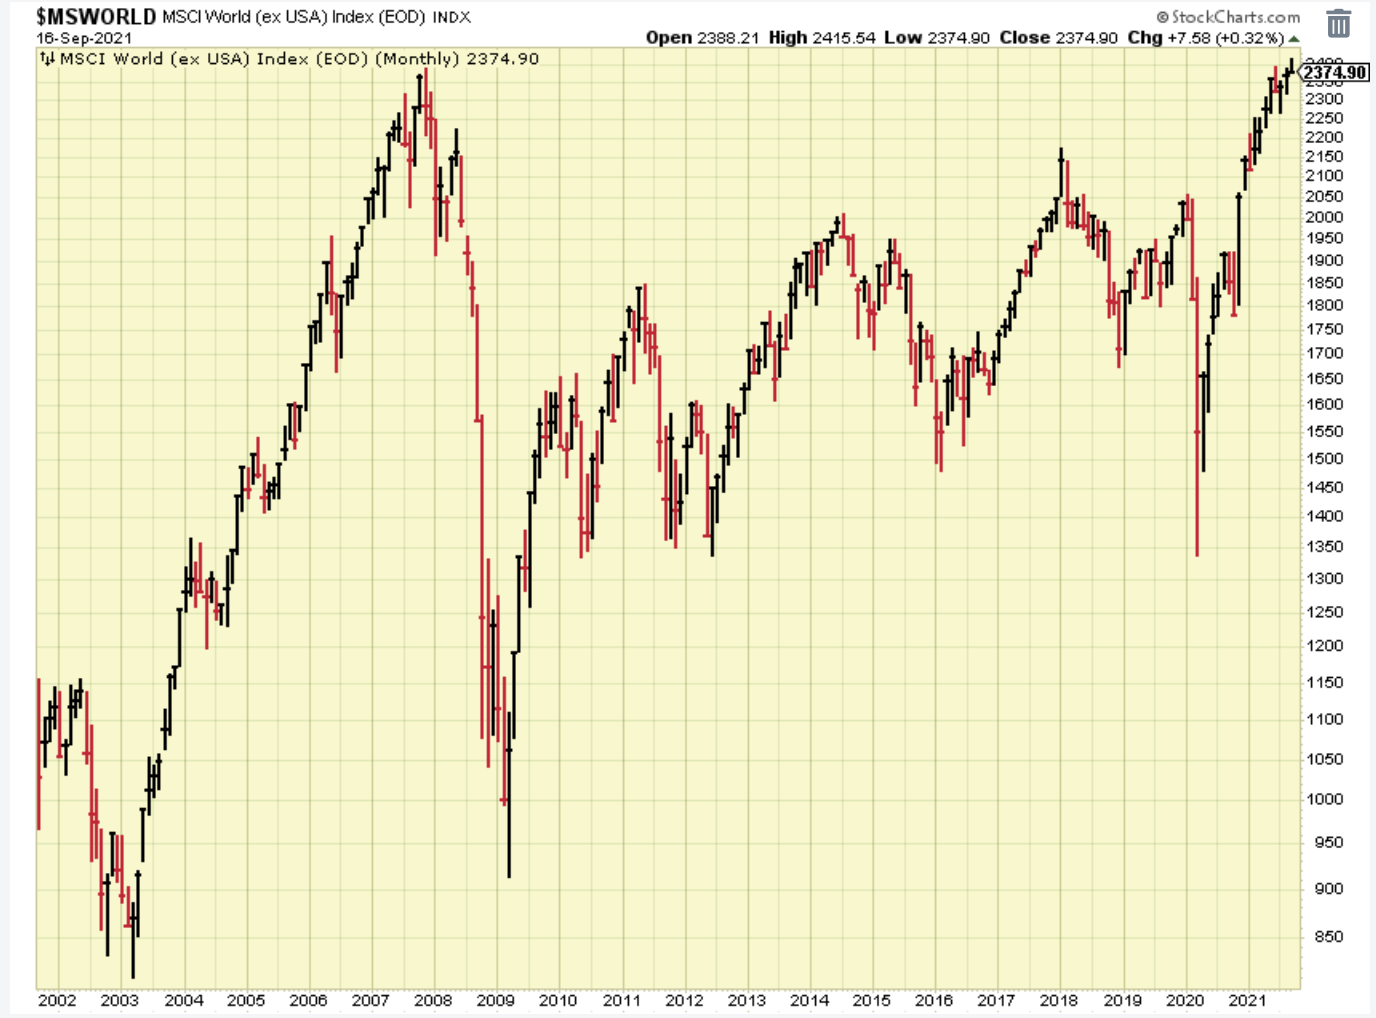
Someone on the news mentioned this chart, and that it is looking like it might break above the 2007 high.
Outlook Summary
- The short-term trend is down for stock prices as of Sept. 7.
- The economy is in expansion as of Sept. 19, 2020.
- The medium-term trend is uncertain for treasury bond prices as of Sept. 10.
Disclaimer: I am not a registered investment adviser. My comments reflect my view of the market, and what I am doing with my accounts. The analysis is not a recommendation to buy, sell, ...
more

