
Emerging Markets Are Trading Bullish As Expected

Image Source: Pixabay
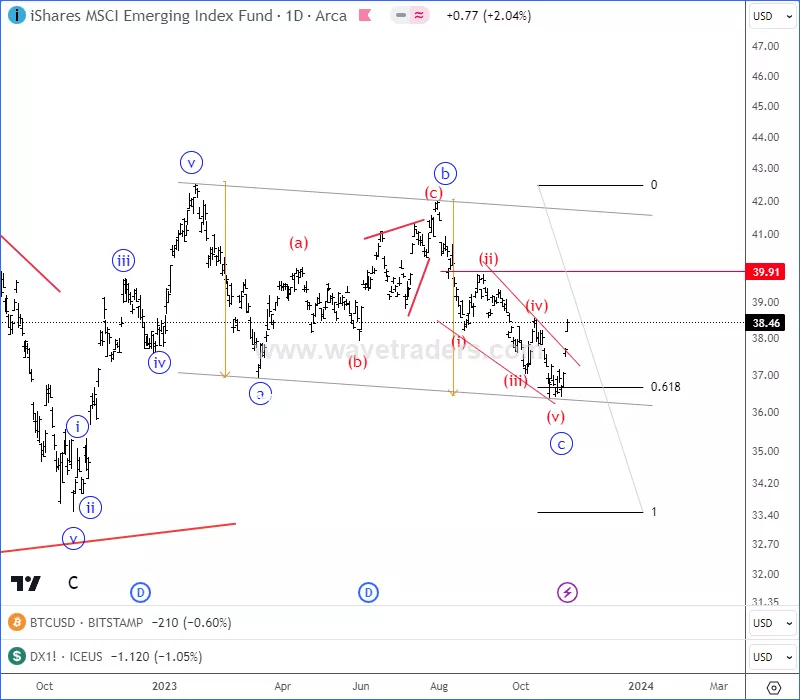
Emerging markets chart with ticker EEM has been trading slow and sideways for the last year, mainly because of weak China stocks. But, we have been warning about a bullish setup formation with nice support at 61,8% Fibo. retracement and 36-35 area last year.
On November 6th of 2023, we have actually spotted a completed a-b-c correction within uptrend and we warned about a bullish continuation in 2024.
EEM Daily Chart From November 06
(Click on image to enlarge)
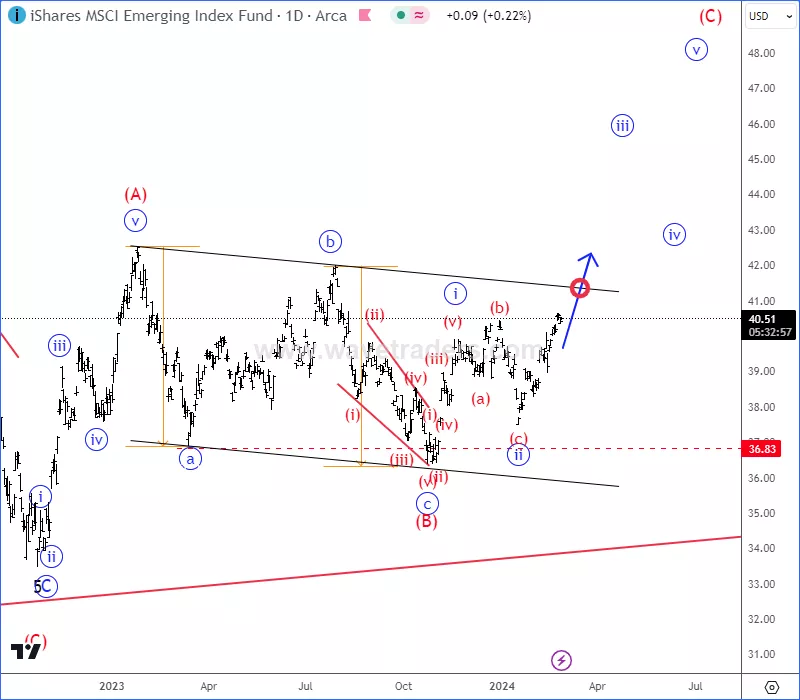
As you can see today, EEM is trying to continue higher within a five-wave bullish impulse, so more gains can be seen this year, especially if breaks channel resistance line and 42 region. Bullish EEM is supportive for the stock market across the globe and it can send it even higher, but we believe that most of that rally may come from China.
EEM Daily Chart From February 27, 2024
(Click on image to enlarge)
More By This Author:
“The Graph” Is Recovering From 2022 Lows As Anticipated
Nvidia Is Making A Pullback Ahead Of Earnings
Binance Coin Is Ready For A Bullish Continuation
For more analysis visit us at https:/www.wavetraders.com and make sure to follow us on Twitter https://twitter.com/GregaHorvatFX


