
“The Graph” Is Recovering From 2022 Lows As Anticipated

Image Source: Freepik
Cryptocurrency “the Graph” with ticker GRTUSD is nicely recovering for the last year as expected. If we go all the way back to January of 2023, you can see that we have spotted strong support within a larger three-wave A-B-C corrective decline at the end of 2022.
GRTUSD Daily Chart From January 31, 2023
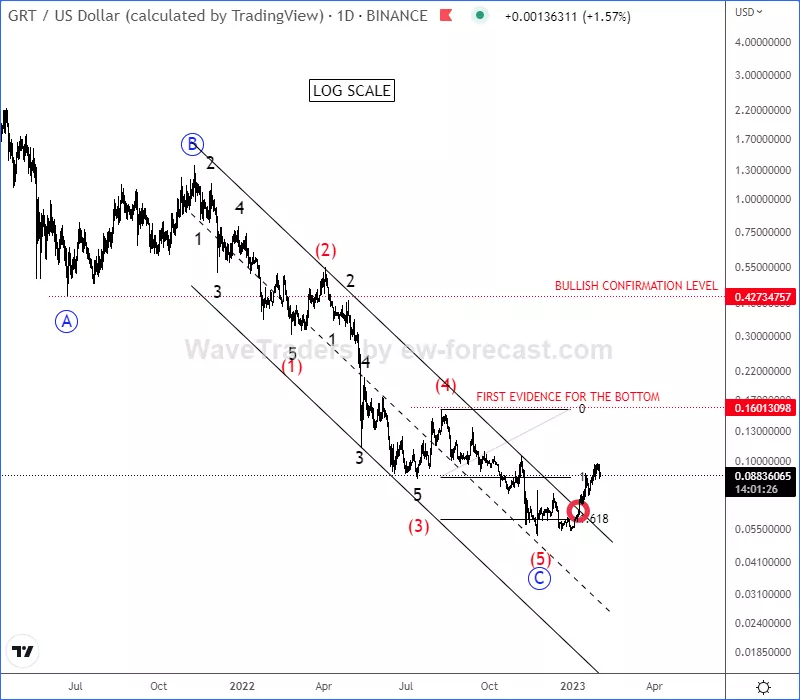
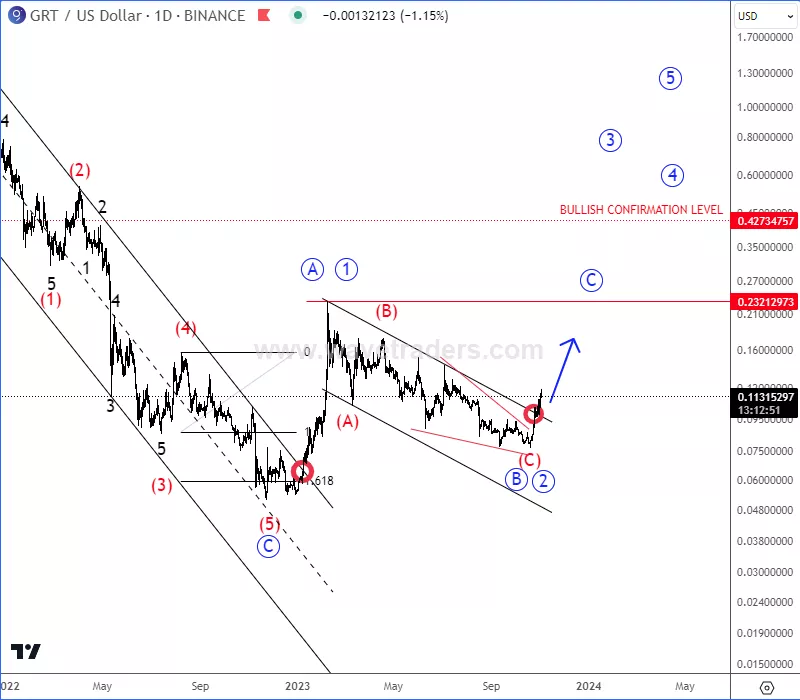
GRTUSD actually made sharp and impulsive rally till February of 2023, which was barely first leg A/1 of a minimum three-wave A/1-B/2-C/3 recovery. Since February till October we were tracking a larger (A)-(B)-(C) corrective setback in B/2, from where we were expecting more upside within higher degree wave C/3. In November, GRT finally broke the channel resistance line, which was signal that wave C/3 is underway.
GRTUSD Daily Chart From November 02, 2023
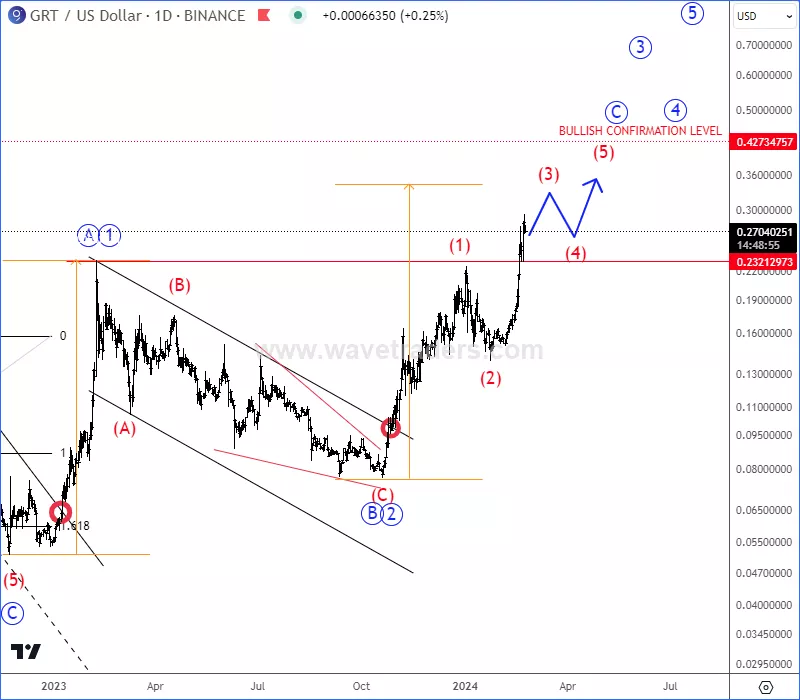
As you can see today, GRT is breaking 2023 highs as expected and it can be trading in wave (3) of a five-wave bullish cycle within higher degree wave C/3. So, more upside is expected at least up to 0.30 – 0.35 area for wave (5), just be aware of a pullback in wave (4). Higher degree wave 3 can be considered only above 0.42 bullish confirmation level.
GRTUSD Daily Chart From February 23, 2024
More By This Author:
Nvidia Is Making A Pullback Ahead Of Earnings
Binance Coin Is Ready For A Bullish Continuation
TLT Is In A Correction Within Uptrend
For more analysis visit us at https:/www.wavetraders.com and make sure to follow us on Twitter https://twitter.com/GregaHorvatFX


