
DSLV Update…The Chartology Of Silver
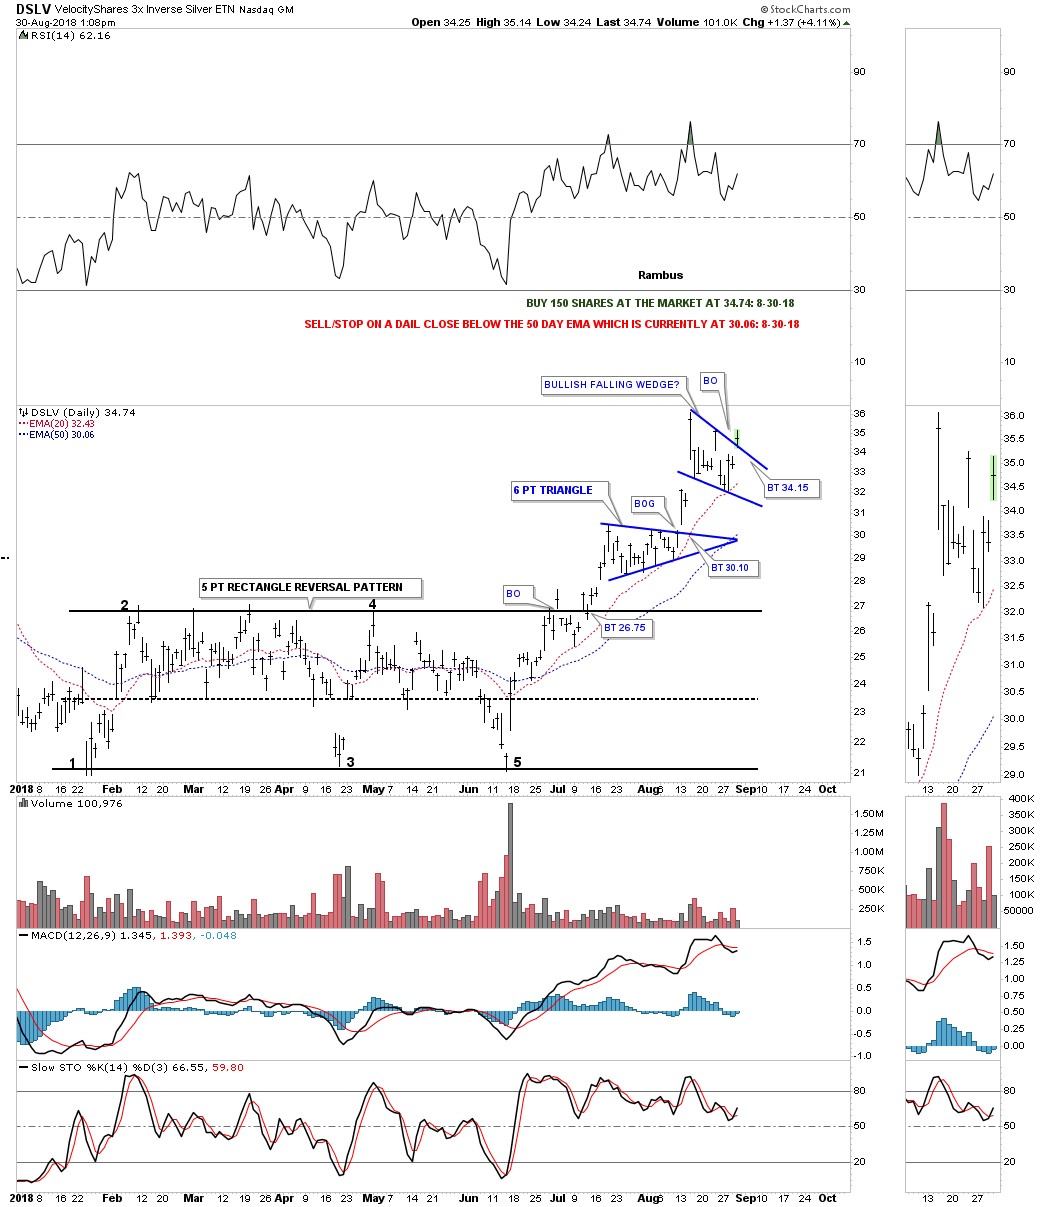
Today DSLV 3 X short silver ETF, is breaking out from a possible bearish falling wedge. I’m going to take an initial position and buy 150 shares at the market at 34.74 with the sell/stop on a daily close below the 50-day ema which is currently at 30.06. ZSL is a 2 X leveraged ETF if you don’t want all the leverage. DSLV can be pretty volatile so take small bites. A backtest to the top rail would come into play around the 34.15 area for a slightly lower risk entry point.
Below is a daily line chart for SLV which shows a possible bear flag forming.

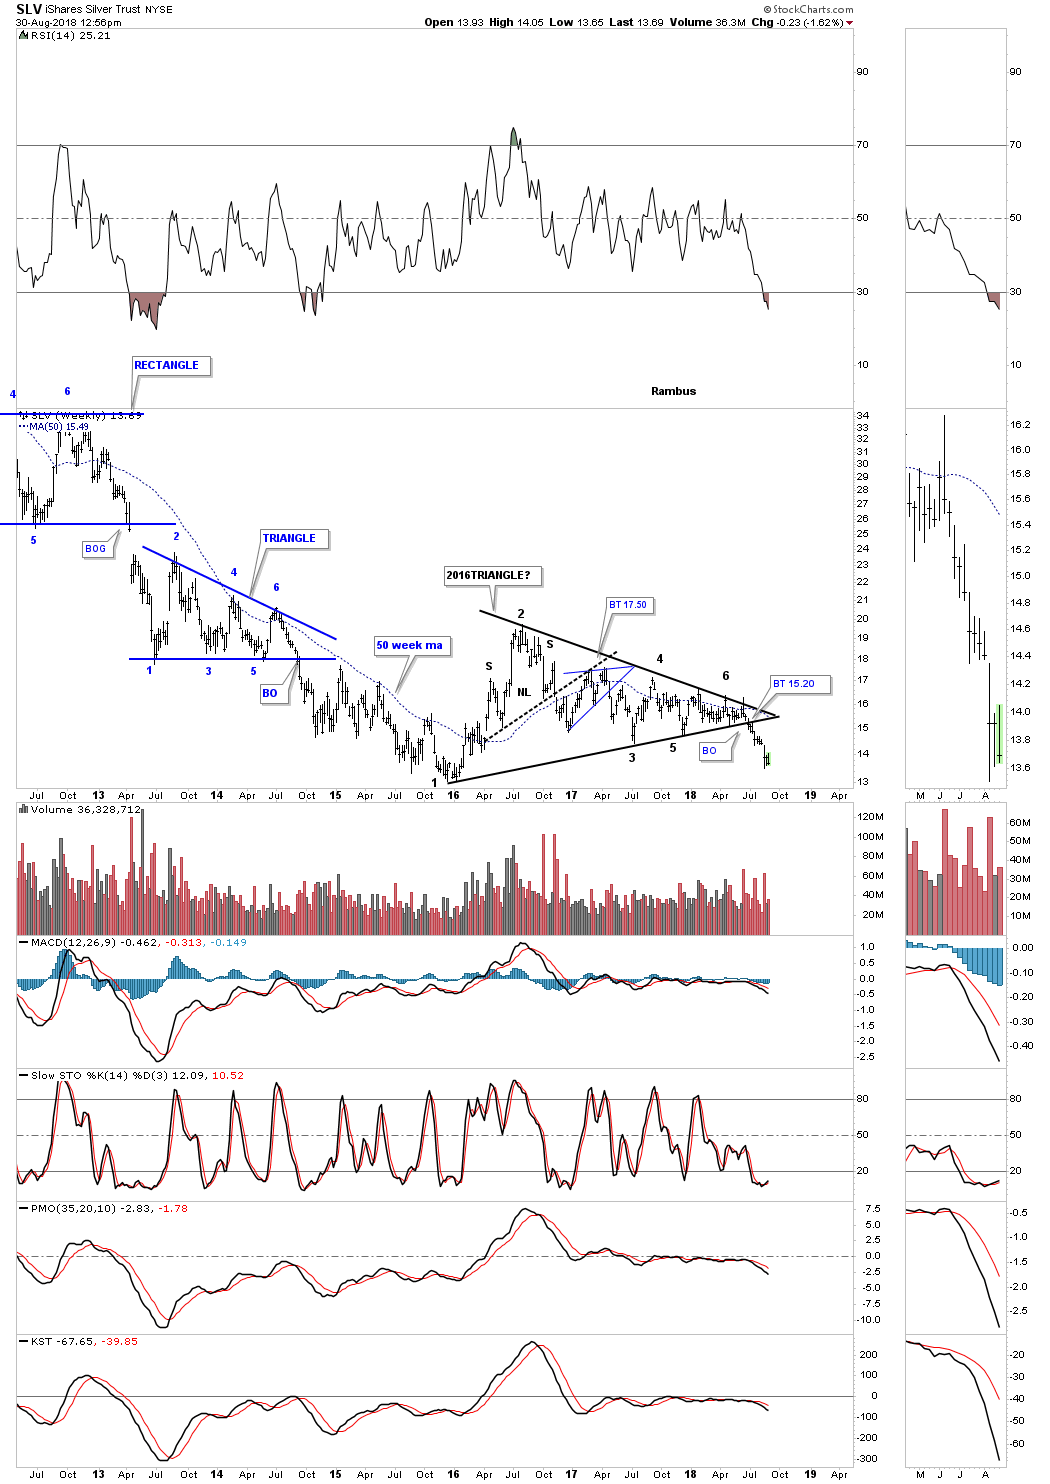
The weekly chart for SLV shows a similar 2016 triangle to the one we’ve been following on gold. Keep in mind the dominate chart pattern is the 2 1/2 year triangle which is releasing its energy to the downside.
Disclosure: None.


