
Commitment Of Traders, Hedge Fund Positions - As Of March 5
Following futures positions of non-commercials are as of March 5, 2019.
10-year note: Currently net short 233.4k, down 619.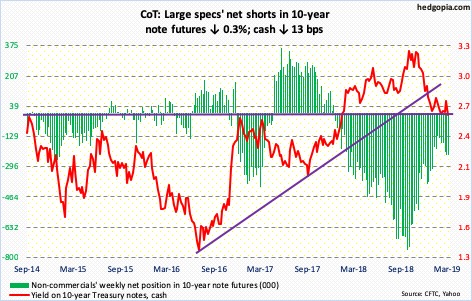
The rally in the 10-year Treasury yield (2.63 percent) from July 2016, when rates bottomed at 1.34 percent, ended last October at 3.25 percent. By December, a rising trend line from that low was lost. Support at 2.62 percent goes back a decade. This has been defended several times this year. Downside risks are rising. A decisive breakdown raises the odds that in due course the 10-year heads toward two percent.
30-year bond: Currently net short 30.2k, down 4.5k.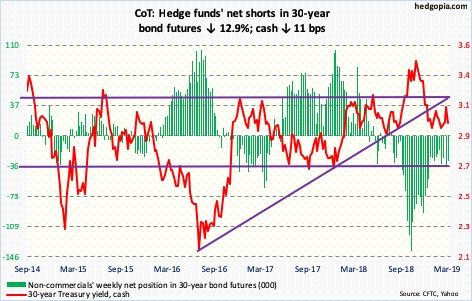
Major economic releases next week are as follows.
Retail sales for January are due out Monday. Sales dropped 1.2 percent month-over-month in December to a seasonally adjusted annual rate of $505.8 billion.
On Tuesday, the NFIB small-business index and the consumer price index – both for February – are published.
- Small-business optimism fell 3.2 points m/m in January to 101.2. This was the 26th consecutive month of 100-plus readings, of which last August’s 108.8 was the record.
- Consumer prices were unchanged m/m in January and rose 1.6 percent in the 12 months to January. In the same period, core CPI increased 0.2 percent and 2.15 percent respectively.
Wednesday brings the producer price index (February) and durable goods (January).
- Producer prices in January dipped 0.1 percent m/m and rose two percent year-over-year. In the 12 months through January, core PPI rose two percent and 2.6 percent respectively.
December orders for non-defense capital goods ex-aircraft – proxy for business capex plans – rose two percent y/y to $68.2 billion (SAAR). Growth has rapidly decelerated since last July’s 8.8-percent pace.
January’s new home sales is on tap Thursday. Sales rose 3.7 percent m/m in December to 621,000 units (SAAR). A decade-high 712,000 was recorded in November 2017.
Industrial production (February), JOLTS (January), University of Michigan’s consumer sentiment index (March, preliminary) and Treasury International Capital data (January) are scheduled for Friday.
Growth in capacity utilization decelerated to 1.6 percent y/y in December to 78.2 percent. Last November’s 78.9 percent was the highest since December 2014.
Non-farm job openings jumped 169,000 m/m in December to 7.34 million – a new record.
Consumer sentiment in February rose 2.6 points m/m to 93.8. Last March’s 101.4 was the highest reading since January 2004.
Through December, foreigners continued to cut back exposure to US equities, with a 12-month rolling total of minus $129.5 billion. As recently as last August, they were buying $16.4 billion worth.
Crude oil: Currently net long 462.5k, up 29k.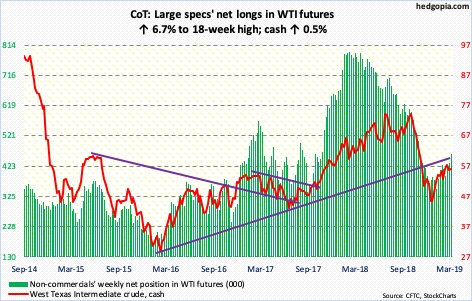
The cash ($56.07/barrel) bottomed on Christmas Eve at $42.36, rallying to $57.88 on March 1. There is decent resistance at $58. The path of least resistance is down. The 50-day moving average lies at $52.97.
US crude production continues to rise, up 400,000 barrels per day year-to-date to 12.1 million bpd. The latest reading is as of March 1. In that same week, crude imports increased by 1.1 mbpd week-over-week to 7 mbpd. Crude stocks rose by 7.1 million barrels to 452.9 million barrels. Gasoline and distillate stocks, however, fell – by 4.2 million barrels and 2.4 million barrels to 250.7 million barrels and 136 million barrels, in that order. Refinery utilization inched up four-tenths of a percentage point to 87.5 percent.
E-mini S&P 500: Currently net short 103.4k, up 16.9k.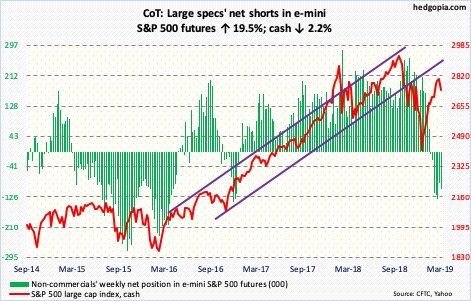
The 10-week rally the cash (2743.07) began on Boxing Day hit the wall just north of 2800. This resistance goes back a year, having repelled rally attempts several times in October-December last year. This is not going to break that easy – not when conditions are as extended as they are. The inability to take out this ceiling also opens door for the weekly to continue to unwind, particularly so when flows are not cooperating.
In the week to Wednesday, US-based equity funds lost $7 billion. Since the S&P 500 bottomed late December, these funds have lost $21.9 billion. In all of last year, they lost $81 billion (courtesy of Lipper). Also last year, foreigners reduced exposure to US stocks by $129.5 billion. The only shining light was buybacks by S&P 500 companies, who spent $800 billion last year, up from $519 billion in 2017. It is all good except (1) the S&P 500 lost 6.2 percent last year, and (2) the 2018 buyback pace is simply unsustainable.
Euro: Currently net short 78.2k, up 5.7k.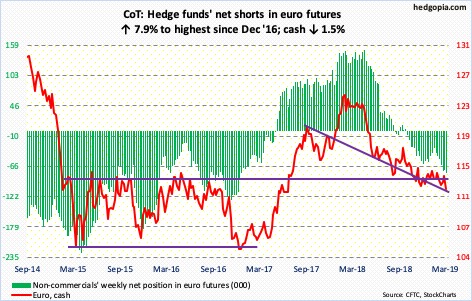
The ECB dropped a bombshell. Pretty much.
It is launching a new stimulus program called TLTRO-III starting in September this year. These are loans at cheap rates to banks in the eurozone. Also, key interest rates will remain unchanged at their current levels at least through the end of 2019, versus prior guidance of through to the end of the summer.
Eurozone growth is stalling. This week, the OECD once again cut global economic growth forecasts – from 3.5 percent to 3.3 percent this year; the eurozone’s was downgraded from 1.8 percent to one percent.
Post-financial crisis, the ECB more than doubled its balance sheet from €2.04 trillion in September 2014 to €4.7 trillion this February. With the bank unable to sustainably ignite economic growth and inflation, there is not much to show for this excessive money-printing.
The cash ($112.31) reacted to the ECB’s dovish shift by dropping one percent Thursday. Support at $113 is gone.
Gold: Currently net long 88k, down 47.7k.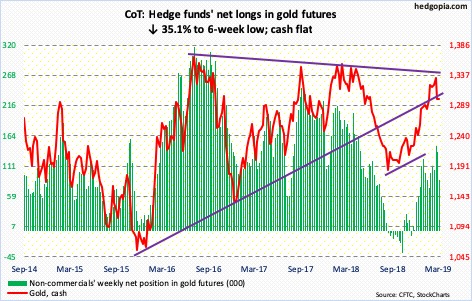
Three weeks ago, gold’s six-month advance ended with a weekly shooting star after rallying to $1,349.80/ounce. There was major resistance at $1,350-$1,360.
Early this week, the cash ($1,299.3) lost the 50-day, as well as $1,300. But gold bugs put their foot down in the remaining sessions. The daily is oversold. Bulls need to recapture $1,300 to regain momentum.
Non-commercials continued to cut back net longs, even as GLD (SPDR gold ETF) in the week to Wednesday lost $921 million, for outflows of $2.4 billion in the past five (courtesy of ETF.com). The metal still managed to end the week flat.
Nasdaq 100 index (mini): Currently net short 21.2k, up 1.8k.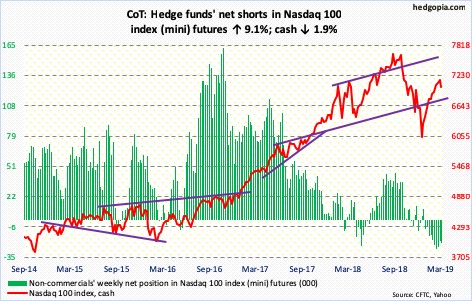
The cash (7015.69) rallied for 10 consecutive weeks before dropping 1.9 percent this week. Importantly, this week’s bearish engulfing candle preceded a hanging man last week. The Nasdaq 100 rallied north of 22 percent before facing resistance at 7100-7200. Conditions are way extended. Support lies at 6600, with the 50-day at 6803.94.
In the week through Wednesday, QQQ (Invesco QQQ trust) lost $678 million (courtesy of ETF.com). It will be interesting to see how non-commercials will react to this week’s selloff in the cash. They have remained short since pretty much when the latest rally began.
Russell 2000 mini-index: Currently net long 4.9k, up 7.3k.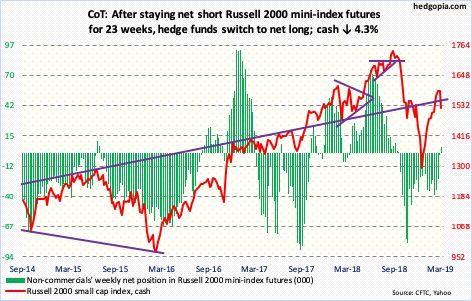
Small-caps bore the brunt of the selloff this week. The cash (1521.88) was down 4.3 percent. After rallying north of 26 percent from the December 24 low, the Russell 2000 peaked two weeks ago at 1602.10. There was major resistance at that level. It has held. In the right circumstances, bears have a shot at 1450s in the weeks ahead. The 50-day rests at 1487.93.
IWM (iShares Russell 2000 ETF) has bled for a while, with only one positive week in the last 10, for a total loss of $4.3 billion. In the latest week to Wednesday, $808 million was withdrawn; in the same week, IJR (iShares core S&P small-cap ETF) lost $17 million (courtesy of ETF.com).
US Dollar Index: Currently net long 33.7k, up 1.8k.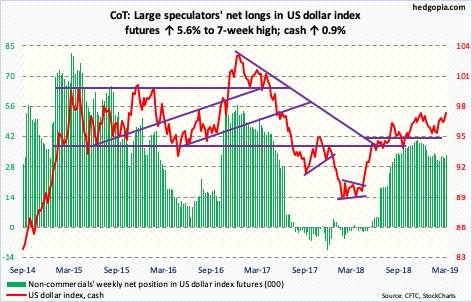
Dollar bulls owe it to the ECB this week.
The euro makes up 57.6 percent of the US dollar index. Thursday, the cash (97.27) jumped 0.9 percent, breaking out of resistance at just under 97. For continued momentum, it needs to take out 97.50-98.
VIX: Currently net short 94.1k, up 4.4k.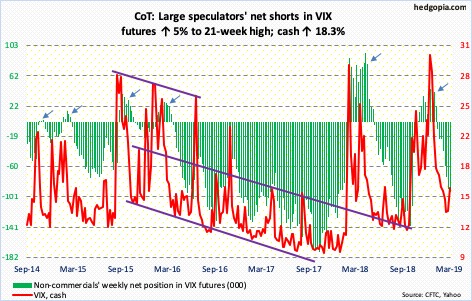
The cash (16.05) bottomed intraday Monday at 13.38. The daily Bollinger bands are beginning to widen. That said, Friday’s rally attempts were rejected at the 50-day. Near-term notwithstanding, VIX has room to rally in the weeks to come. Several momentum indicators just turned up on the weekly.
In the meantime, the 21-day moving average of the CBOE equity-only put-to-call ratio bottomed at 0.594 on March 1, with Friday at 0.623. On December 24, the ratio stood at elevated 0.744, the subsequent unwinding of which helped stocks to the upside. The ratio will be unwound again, but in the other direction. Stocks tend to come under pressure as the ratio rises toward high-0.60s/low-0.70s.
Disclaimer: This article is not intended to be, nor shall it be construed as, investment advice. Neither the information nor any opinion expressed here constitutes an offer to buy or sell any ...
more

