
ARK Fintech Innovation ETF – ARKF Elliott Wave Technical Analysis
ARK Fintech Innovation ETF – ARKF (1D) Elliott Wave Technical Analysis
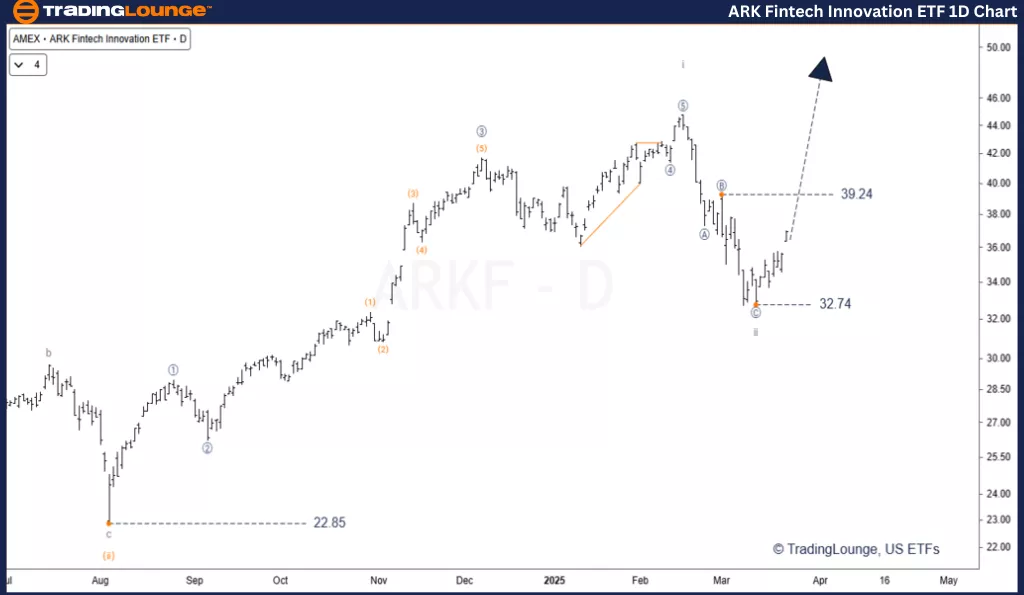
Daily Chart
Function: Major Trend
Mode: Motive
Structure: Impulse Wave
Position: Wave iii
Direction: Uptrend
Details:
The current rally is identified as part of the third wave (wave iii), typically associated with the strongest momentum.
This wave is expected to bring high trading volume and strong bullish movement.
New highs are likely during this phase.
Wave ii should be fully retraced.
Invalidation Level: $47.22
ARK Fintech Innovation ETF – ARKF (4H) Elliott Wave Technical Analysis
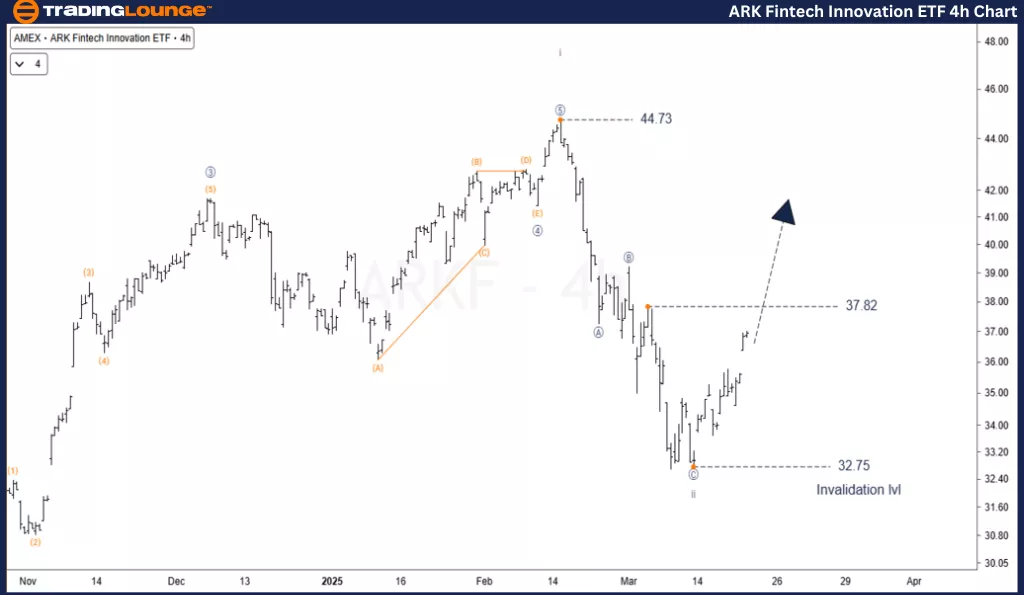
4-Hourly Chart
Function: Major Trend
Mode: Motive
Structure: Impulse
Position: Wave [1] of iii
Direction: Uptrend
Details:
Wave ii concluded at $32.75 in a zigzag structure.
A minor bullish confirmation came when price breached subwave 4 of [C] within wave ii.
A brief consolidation may occur near $37.82 before prices move higher.
The recent high of $44.73 is likely to be surpassed during this rally.
The key level to monitor is $35.00.
Invalidation Level: $32.75
Conclusion:
ARKF is advancing in wave iii, typically the strongest and most dynamic phase in an impulse wave.
Wave 3s often reflect significant upside potential and are known for high volume and rapid price increases.
This presents a favorable scenario for bullish traders, especially ETF investors.
Staying within Elliott Wave guidelines and monitoring the invalidation levels is essential for managing risk and protecting positions.
Technical Analyst: Siinom
More By This Author:
Elliott Wave Technical Analysis: Bitcoin Crypto News - Tuesday, March 25
Unlocking ASX Trading Success: Insurance Australia Group Limited - Monday, March 24
Elliott Wave Technical Analysis - Microsoft Inc.
At TradingLounge™, we provide actionable Elliott Wave analysis across over 200 markets. Access live chat rooms, advanced AI & algorithmic charting tools, and curated trade ...
more

