
Elliott Wave Technical Analysis: Bitcoin Crypto News - Tuesday, March 25
Elliott Wave Analysis TradingLounge Daily Chart
Bitcoin/U.S. Dollar (BTCUSD)
BTCUSD Elliott Wave Technical Analysis
Function: Counter Trend
Mode: Corrective
Structure: Zigzag
Position: Wave C
Next Higher Degree Direction: Wave ((II))
Wave Cancel Invalid Level: (not specified)
Bitcoin/U.S. Dollar (BTCUSD) Trading Strategy:
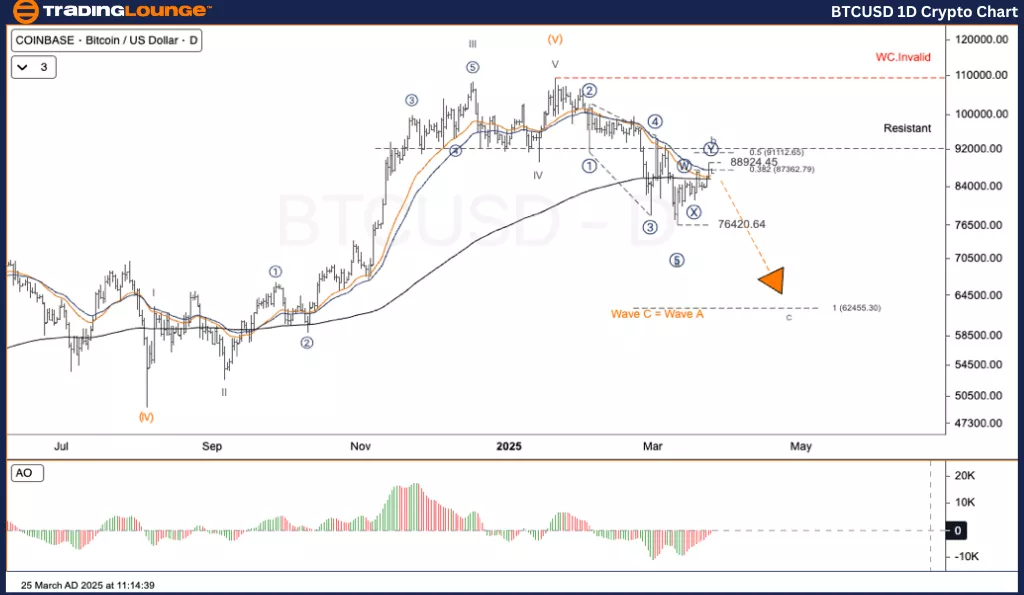
Although Bitcoin has shown a recovery over the past week, and some believe the upward trend may resume, Elliott Wave analysis still identifies the movement as corrective, within an a–b–c structure. We are approaching a downward move in wave c, which may result in a more significant drop than currently anticipated.
Wave (V) has concluded → The market is entering an A-B-C corrective pattern.
Wave b is developing into a Double Zigzag pattern (W)-(X)-(Y). The price is nearing the end of wave b and is about to start wave c.
Trading Strategies
Strategy
For Short-Term Traders (Swing Trade):
Monitor for reversal signals around the $88K–91K zone.
On spotting a reversal or divergence → Initiate a short position.
Target Range: $68,000 → $62,000
Risk Management:
If Bitcoin breaks above $112K clearly → This would invalidate the corrective structure and suggest a bullish scenario.
Elliott Wave Analysis TradingLounge H4 Chart
Bitcoin/U.S. Dollar (BTCUSD)
BTCUSD Elliott Wave Technical Analysis
Function: Counter Trend
Mode: Corrective
Structure: Zigzag
Position: Wave C
Next Higher Degree Direction: Wave ((II))
Wave Cancel Invalid Level: (not specified)
Bitcoin/U.S. Dollar (BTCUSD) Trading Strategy:
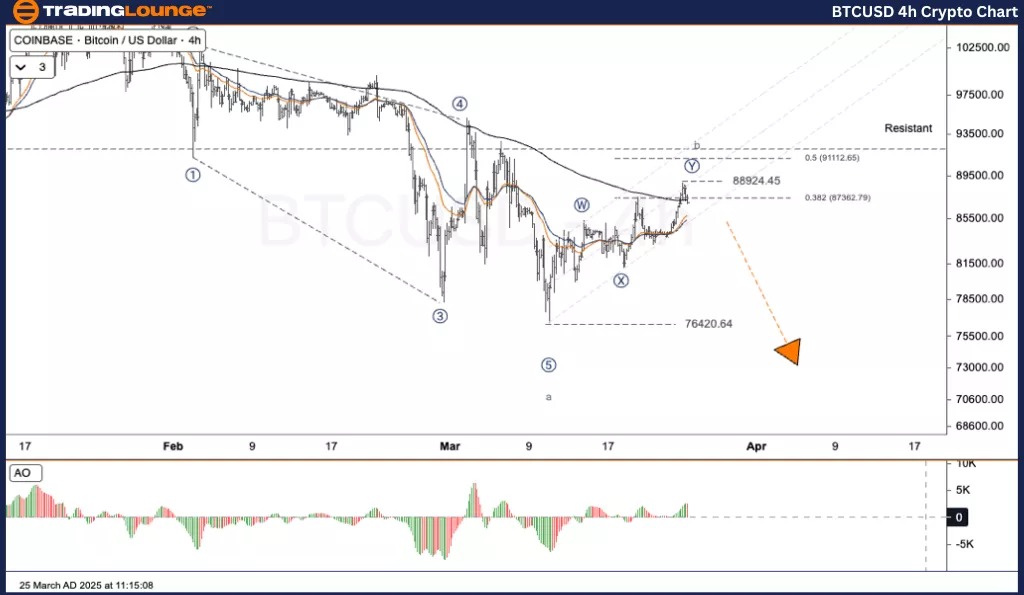
Despite recent upward price action in Bitcoin, Elliott Wave indicators suggest that the market remains in a corrective a–b–c structure. We are moving towards wave c, which could push the price downward beyond common expectations.
Wave (V) is complete → We are in an A-B-C corrective phase.
Wave b is shaping into a Double Zigzag (W)-(X)-(Y), with the price nearing the end of wave b and preparing for wave c.
Trading Strategies
Strategy For Short-Term Traders (Swing Trade):
Look for reversal signs within the $88K–91K range.
Once a reversal or divergence is confirmed → Consider shorting.
Target Zone: $68,000 → $62,000
Risk Management:
A definitive break above $112K would negate the corrective setup and indicate a bullish reversal.
TradingLounge Analyst: Kittiampon Somboonsod, CEWA
More By This Author:
Unlocking ASX Trading Success: Insurance Australia Group Limited - Monday, March 24
Elliott Wave Technical Analysis - Microsoft Inc.
Elliott Wave Technical Analysis: Australian Dollar/U.S. Dollar - Monday, March 24
At TradingLounge™, we provide actionable Elliott Wave analysis across over 200 markets. Access live chat rooms, advanced AI & algorithmic charting tools, and curated trade ...
more

