
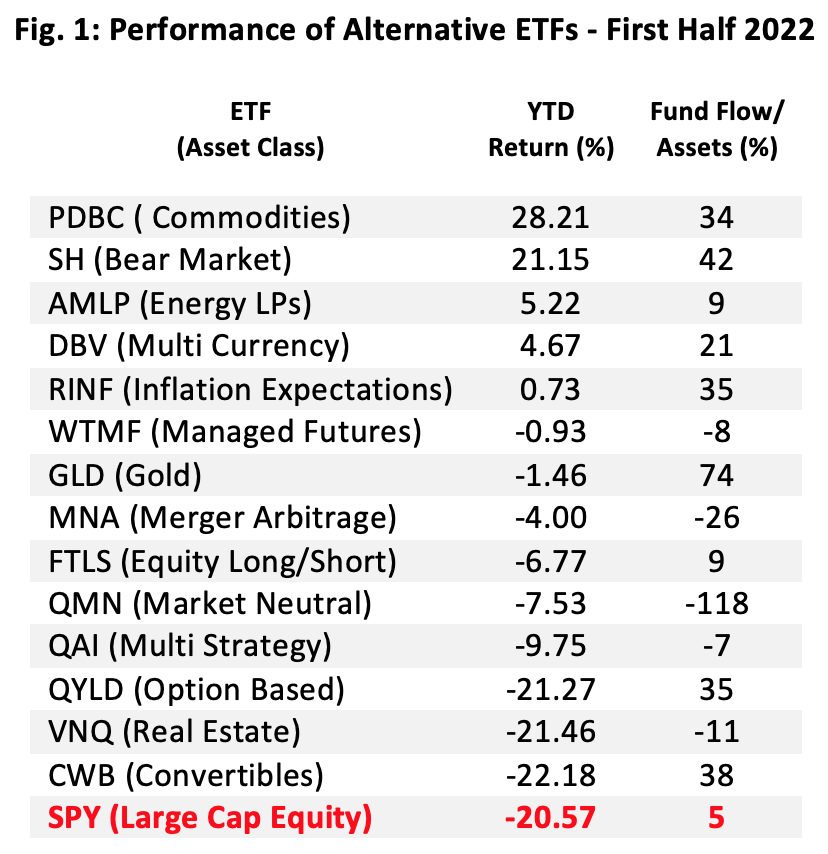
Alternative ETFs At Mid-Year
The book’s now closed on the first half of 2022 and it didn’t read well for most assets. Just five of our 14 benchmark alternative ETFs gained ground this year. At the top of the performance table is the long-only commodity class, represented by the Invesco Optimum Yield Diversified Commodity Strategy No K-1 ETF (PDBC) which not only appreciated 28% but also attracted more than $2.9 billion in net capital inflows, boosting its asset base by more than a third.
Another $1.1 billion flowed into the ProShares Short S&P 500 (SH), which produced an unleveraged gain of 21% through June 30.
We’ve recently highlighted commodity portfolios, bearish and anti-beta exposures as well as energy hedges, but we’ve paid scant attention lately to two of the other asset classes topping our table.
Currencies—at least a currency carry trade strategy—provided a rare opportunity for profits, however modest, in the first half.
The DB G10 Currency Harvest (DBV) offers a classic currency carry trade strategy executed through the futures market. It seeks to exploit the tendency of high-yielding currencies to rise in value relative to lower-yielding currencies. DBV’s methodology calls for long positions to be taken in currencies associated with higher interest rates and to short currencies backed by low rates.
In a cash-based carry trade, the object is the capture of the interest rate differential over time. A trader stands to profit from the spread as long as exchange rates remain stable. If rates move against so-called funding currencies—those that are shorted in DBV’s case—returns can be magnified. If instead, the asset currencies—those held long—depreciate, returns may be diminished.
The ideal time to initiate carry trades is when central banks contemplate interest rate hikes. That’s when demand for asset currencies can be expected to rise. If, however, accommodation is the rule of the day, i.e., when rates decline for asset currencies, the potential for carry trade profits dwindles.
The universe from which DBV’s underlying index draws currencies includes U.S. dollars, euros, Japanese yen, Canadian dollars, Swiss francs, British pounds, Australian dollars, New Zealand dollars, Norwegian krone, and Swedish krona.
Presently, DBV is long Canadian (CAD) and New Zealand (NZD) dollars while short Japanese yen (JPY), the euro (EUR) and Swiss francs (CHF).
Fig. 2: One-Year Currency Performance vs DBV
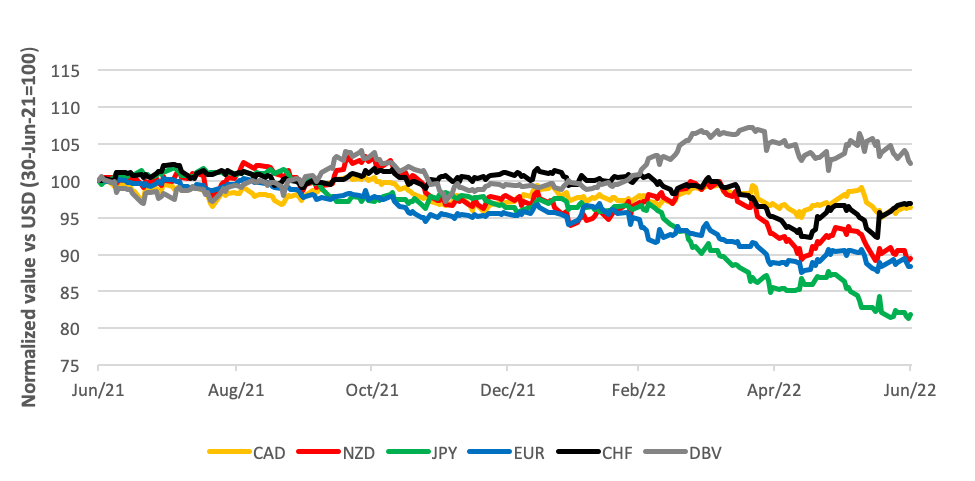
Fig. 3: Central Bank Policy Rates (%)
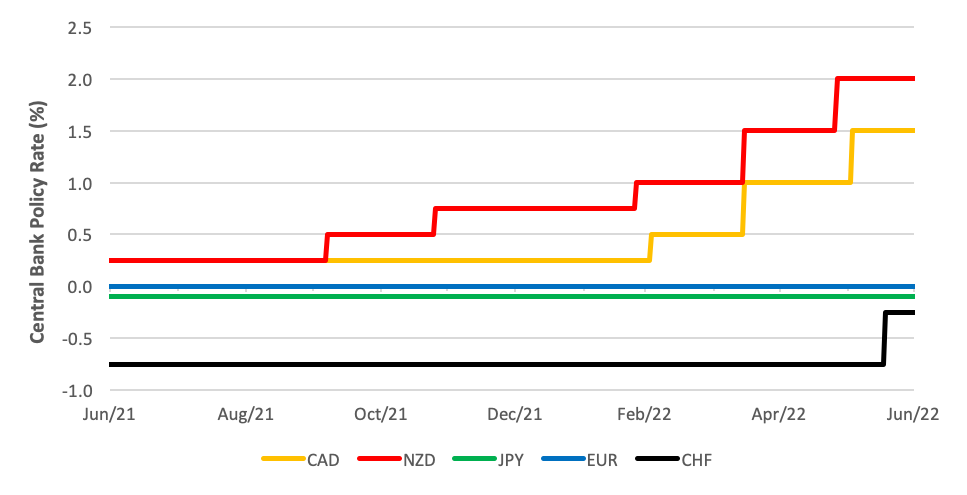
DBV awoke from its somnambulance in early March (see Fig. 2) when the Bank of Canada took its cue from New Zealand’s central bank and hiked its overnight policy rate by 25 basis points. Bigger lockstep moves then ensued through the end of the second quarter (see Fig. 3), widening the rate spread against the listless funding currencies until the Swiss National Bank yanked its rate up a half point in mid-June.
With the present technical momentum, there’s room for DBV to test a price level some 17% higher than its June 30 close before its next rebalance.
Central bank tightening also loomed large on the domestic front as the U.S. Federal Reserve ratcheted rates upward to combat virulent inflation. The Fed’s action grossly changed the contour of the Treasury yield curve in the first half. The curve reflects the market’s real-time inflationary expectations.
The ProShares Inflation Expectations ETF (RINF) is designed to profit from mounting inflationary fears. Generally speaking, Treasury yields tend to rise relative to those of TIPS (Treasury Inflation-Protected Securities) when investors and traders expect more inflation. As yields rise, of course, the prices of debt securities tend to decline. RINF’s index strategy captures this dynamic by nominally taking long positions in TIPS and shorting conventional Treasurys of a similar tenure—namely 30 years.
The yield on a constant maturity 30-year U.S. Treasury bond was wrenched upward 124 basis points—a backup equal to 65%—in the first half. Meanwhile, inflation metered by the Consumer Price Index rose from an annual rate of 1.4% at the top of the year to 8.6% by the close of the second quarter. In toto, inflationary expectations spiked in the spring and along with it, RINF’s price.
To a point.
The Fed’s 75-basis-point hike in its overnight lending rate delivered a shock to inflationary expectations in mid-June, forcing RINF to give up much of its spring gains (See Fig.4).
Fig. 4 - First Half Performance: 30-Year U.S. Treasury Real Interest Rate vs RINF Share Price
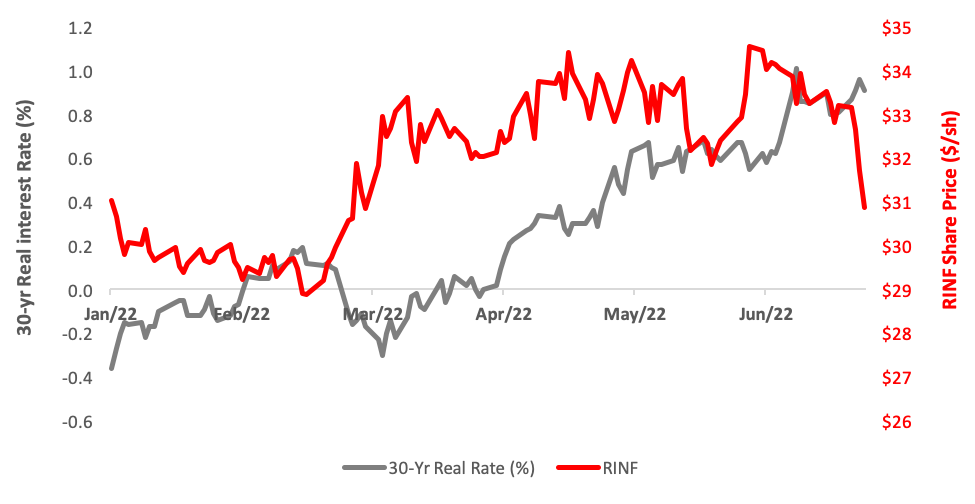
More aggressive tightening by the central bank could send RINF further south. In fact, the June breakdown sets up a test of the $28 level—a depth last explored in 2021—an additional decline of 8% from its mid-year closing price.
More By This Author:
Can’t Decide To Go Long or Go Short on Stocks? Go Long/Short
Managing Interest Rate Risk with TIPS
Alts Do Well in 2022. Well, Some Alts
Disclosure: Brad Zigler pens Wealthmanagement.com's Alternative Insights newsletter. Formerly, he headed up marketing and research for the Pacific Exchange's (now NYSE Arca) option ...
more

