
4 Indicators And The "Bear Market" Rally
(Click on image to enlarge)
Many investors wonder if the recent rally has legs, with the SP 500 down 25% YTD. Unfortunately, only time will tell if Monday’s rally is a dead cat bounce or a more sustainable uptrend.
The market depends on many factors, but investors should always pay close attention to the overall daily price moves of the major US indexes.
Are the indexes closing with higher bottoms than the previous day's price or last week's market close?
Are the major indexes closing at lower lows than the previous day or weekly?
If the price trend is down-there is a potential danger of more significant declines.
The daily closing prices of the market offer helpful direction, but these four indicators might assist you in reading the daily market price action.
Here are four indicators that should warn you of a potential selloff or indicate if this rally has more room to go: junk bonds, 20+ year treasuries, sugar futures, and the VIX.
Here's a closer look at each.
(Click on image to enlarge)

Investors need to be aware of many risks.
Inflation has remained stubbornly high, the Fed is raising rates aggressively, corporate earnings are declining, and high mortgage rates have caused the housing market to cool, to name a few.
Junk bonds can indicate where the stock market is heading. That's because they're more sensitive to changes in interest rates than other types of bonds. When junk bond prices start falling, it's often a sign that investors are losing confidence and are looking for safety trades.
So, if junk bonds start to fall in value, it's a good sign that the stock market might fall.
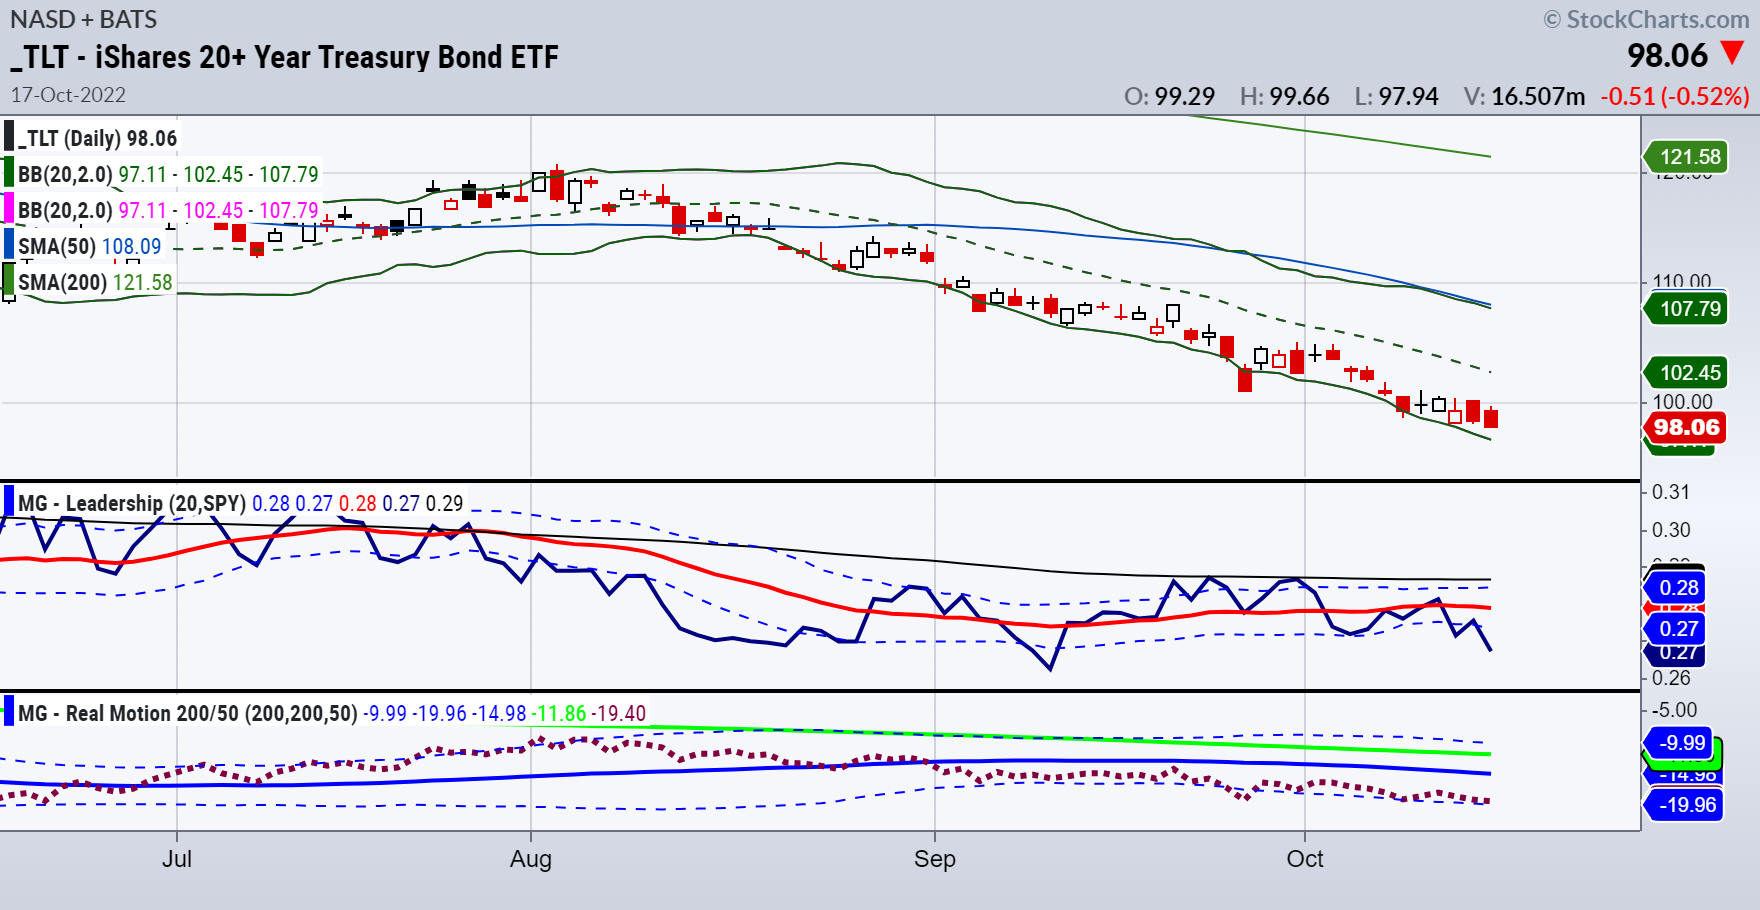
Treasuries are also affected by changes in interest rates, but they're not as sensitive as junk bonds. That means they can be an excellent leading indicator of where interest rates are headed. If treasury yields continue to rise, it's a sign that the stock market might sell off as a result. So, watch the price of TLTs since price and yield have an inverse relationship.
Sugar futures are often used as a proxy for the overall commodities market. And like other commodities, sugar prices are closely linked to changes in inflationary pressure. So, if sugar prices start to rise, it's usually a sign that inflation is picking up, and the stock market might move in the opposite direction.
The VIX is often called the "fear index" because it measures how much volatility investors expect over the next thirty days. Now, investors are bracing for more turbulence since the VIX is above 30.
For the current bounce to have legs, the VIX needs to moderate to the mid-20s from around the current 30-plus level.
Of course, no indicator is perfect, and you should also consider the direction of the overall indexes daily when making trading decisions, plus the specific price movement of individual securities.
ETF Summary
S&P 500 (SPY) Reached the 50% Fibonacci level from the March 2020 lows on Thursday, at 351, then rebounded sharply. Under 3510, support 330, and on the upside, resistance 360, 370, 382, and 396.
Russell 2000 (IWM) 162.50 support 177 resistance
Dow (DIA) 285 support 305 resistance
Nasdaq (QQQ) 255 support (could go to 220) 270 resistance
KRE (Regional Banks) 56 support, 60 pivotal 65 resistance
SMH (Semiconductors) 167 support 190 resistance
IYT (Transportation) 195 support and 207 resistance
IBB (Biotechnology) 116.00 support 124 resistance
XRT (Retail) 54-55 support 62 resistance
More By This Author:
Precarious Action In The Bonds And Stock Market
Taking The Temperature Of The Major Sector ETFs
Analyzing Two Stocks In The Grocery Space
Disclaimer: The information provided by us is for educational and informational purposes. This information is based on our trading experience and beliefs. The information on this website is not ...
more

