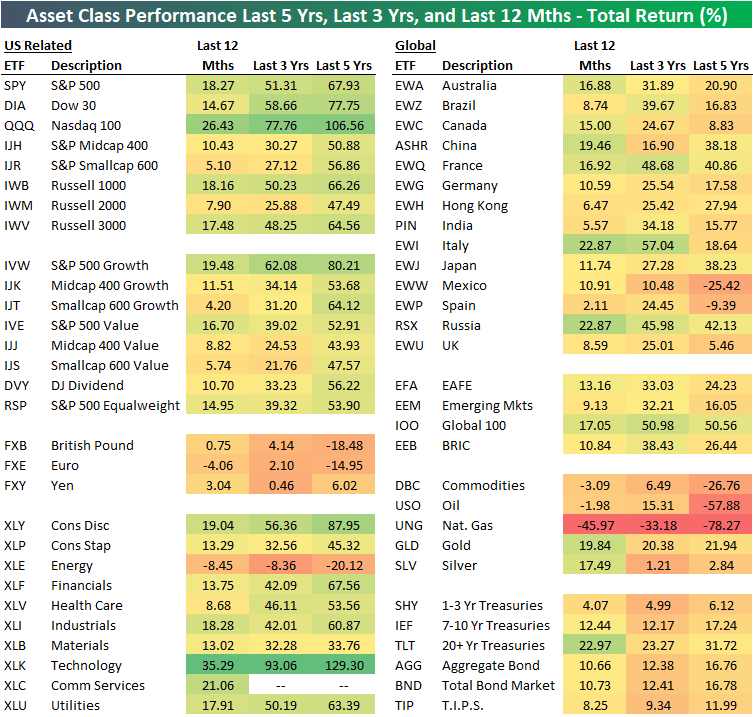
12 Month, 3 Year, And 5 Year Asset Class Total Returns
The table below shows the total returns of various asset classes over the last twelve months, three years, and five years using key ETFs traded on US exchanges.
The US Technology sector (XLK) has posted the strongest returns over all three time periods, with a 35.29% gain over the last year, a 93.06% gain over the last three years, and a 129.3% gain over the last five years. Looking at other sectors, Consumer Discretionary (XLY) has been the second-best performer behind Tech over the three and five-year time frames, while the new Communication Services sector (XLC) has been the second-best over the last twelve months.
On the negative side, the US Energy sector (XLE) is down on a total return basis over all three-time frames. Energy is down 8.45% over the last year, 8.36% over the last three years, and 20.12% over the last five years. That’s how a sector goes from having an S&P 500 weighting of 9% five years ago to a weighting of just over 4% now!
Large-cap growth has been the best factor ETF over all three time frames by a large margin. The S&P 500 Growth ETF (IVW) is up 80.21% over the last five years. The next best of the size/strategy ETFs in our matrix has been Smallcap Growth (IJT) with a five-year total return of 64.12%. On the other hand, Midcap Value (IJJ) has been the weakest factor ETF with a five-year gain of 43.93%.
Internationally, no country ETF in our matrix comes close to the 67.93% gain that the S&P 500 (SPY) has seen over the last five years. Russia (RSX) has been the best of the country ETFs over the five-year time frame with a gain of 42.13%, while France (EWQ), Japan (EWJ), and China (ASHR) rank second through fourth with gains between 38-40%. Mexico (EWW) and Spain (EWP) are both down over the last five years, while countries like the UK (EWU) and Canada (EWC) are only up by single-digit percentage points.
Over the last year, it’s a slightly different story with three countries (China, Italy, Russia) outperforming the S&P 500’s 18.27% gain. Spain (EWP) has been the weakest country over the last year gaining just 2.11%.
The broad commodities ETF (DBC) has been terribly weak versus other asset classes over all three-time frames. DBC is down 3.09% over the last year, up just 6.49% over the last three years, and down 26.76% over the last five years. Most of the pain for commodities has been due to oil and natural gas price weakness. The Oil ETF (USO) is down 57.88% over the last five years while the natural gas ETF (UNG) is down 78.27%! Gold (GLD) has been a positive outlier for commodities with gains of roughly 20% over each of the three-time frames.
Finally, fixed income ETFs have posted very strong returns given their risk-averse characteristics. The widely followed 20+ Year Treasury ETF (TLT) is up 22.97% over the last 12 months, which is 4.7 percentage points better than the S&P 500 over the same time frame!

Disclaimer: Read our full disclaimer here.


