

Image Source: Pexels
NFP +142 vs. consensus +166. Employment has almost surely slowed (keeping in mind this is the preliminary release). What does this look like?
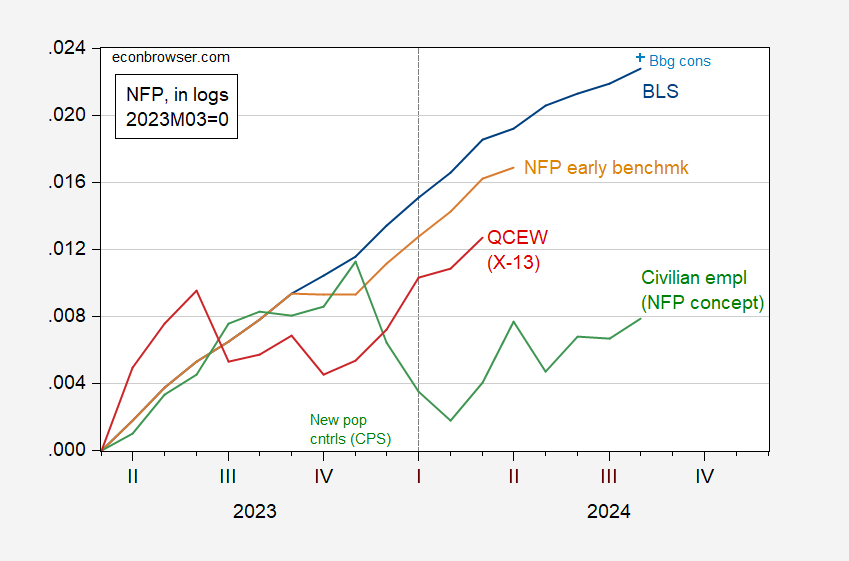
Figure 1: Nonfarm payroll (NFP) employment from CES (blue), Bloomberg consensus assuming no revisions to previous months (light blue), NFP early benchmark (tan), QCEW total covered employment seasonally adjusted by author using X-13 (red), civilian employment adjusted to NFP concept (green), all in logs, relative to 2023M03. Source: BLS, Bloomberg, Philadelphia Fed, and author’s calculations.
With the previous months of revisions, the “miss” on consensus is 108K, not 24K. On the other hand, the CPS version of NFP employment (people, not jobs) was +178 (vs. +142K from CES). Given the high variability in the-CPS-based series, I wouldn’t take too much solace from this.
What about the impact of the preliminary benchmark? As I’ve noted before, this has a big — perhaps too big — impact on the level of measured employment.
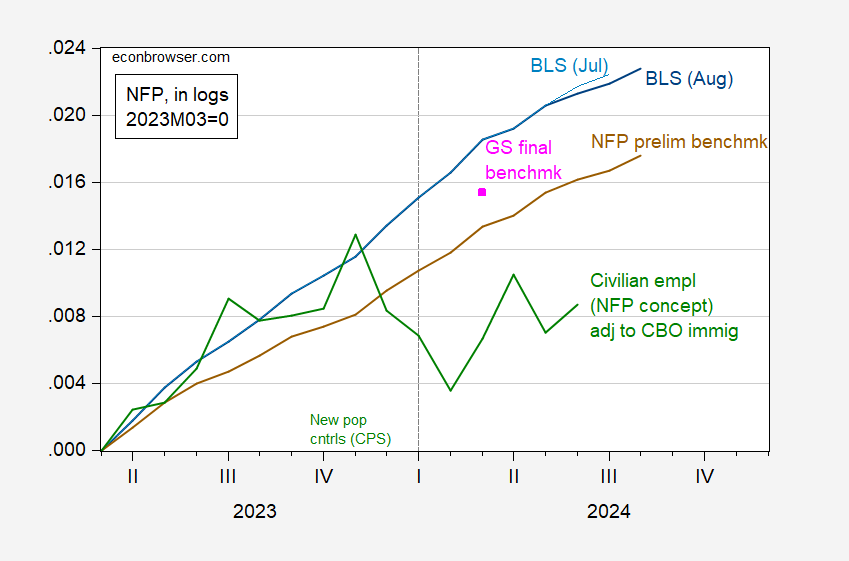
Figure 2: Nonfarm payroll (NFP) employment from August CES (blue), from July CES (light blue), Bloomberg consensus assuming no revisions to previous months (light blue), implied NFP preliminary benchmark (brown), civilian employment adjusted to NFP concept, adjusted by author using ratio of CBO immigration level implied civilian employment (green), Goldman Sachs estimate of NFP final benchmarked employment (pink square), all in logs, relative to 2023M03. Source: BLS, Bloomberg, Philadelphia Fed, and author’s calculations.
I have adjusted the BLS’s alternative NFP employment series by the ratio of my adjustment to civilian employment accounting for the higher employment estimated by CBO (see discussion here), except I have applied to June 2024 the adjustments (2024 is the fiscal year for reporting immigration), instead of to June 2023.
By these counts, employment is still growing on a year-to-year basis, even the CPS based series. Since the graphs are shown on log scales, then it’s clear that the series are decelerating in growth, as the Fed has aimed for.
More By This Author:
A Puzzle: Private NFP And The Preliminary Benchmark Vs. Current Official [Updated]Business Cycle Indicators As Of September’s Start
More On The Preliminary Benchmark In Context


Comments
Log in or sign up to join the conversation.