

Image Source: Pexels
Continued growth apparent, although NFP employment pertains to first half of April.
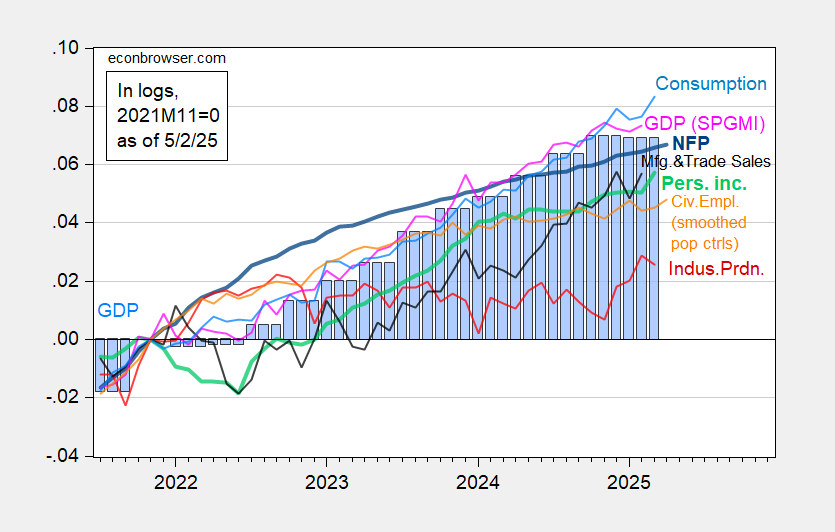
Figure 1: Nonfarm Payroll incl benchmark revision employment from CES (bold blue), implied NFP from preliminary benchmark through December (thin blue), civilian employment as reported (orange), industrial production (red), personal income excluding current transfers in Ch.2017$ (bold light green), manufacturing and trade sales in Ch.2017$ (black), consumption in Ch.2017$ (light blue), and monthly GDP in Ch.2017$ (pink), GDP (blue bars), all log normalized to 2021M11=0. 2025Q1 GDP is advance release. Source: BLS via FRED, Federal Reserve, BEA, S&P Global Market Insights (nee Macroeconomic Advisers, IHS Markit) (4/1/2025 release), and author’s calculations.
Combined with consumption and personal income growth in March, it’s difficult to see the recession in latest available data.
More By This Author:
Monthly Consumption, Personal Income, Mfg/Trade Indus SalesEconomy Stumbles Into 2025
100 Day Marker: Economic Optics Not Great


Comments
Log in or sign up to join the conversation.