
This morning we got the latest Empire State Manufacturing Survey. The diffusion index for General Business Conditions at -31.3 was a decrease of 42.4 from the previous month's 11.1. The Investing.com forecast was for a reading of 5.5.
The Empire State Manufacturing Index rates the relative level of general business conditions in New York state. A level above 0.0 indicates improving conditions, and below indicates worsening conditions. The reading is compiled from a survey of about 200 manufacturers in New York state.
Here is the opening paragraph from the report.
Business activity declined sharply in New York State, according to firms responding to the August 2022 Empire State Manufacturing Survey. The headline general business conditions index plummeted forty-two points to -31.3. New orders and shipments plunged, and unfilled orders declined. Delivery times held steady for the first time in nearly two years, and inventories edged higher. Labor market indicators pointed to a small increase in employment, but a decline in the average workweek. While still elevated, the prices paid index moved lower, and the prices received index held steady. Looking ahead, firms did not expect much improvement in business conditions over the next six months. [Full report]
Here is a chart of the current conditions and its 3-month moving average, which helps clarify the trend for this extremely volatile indicator:
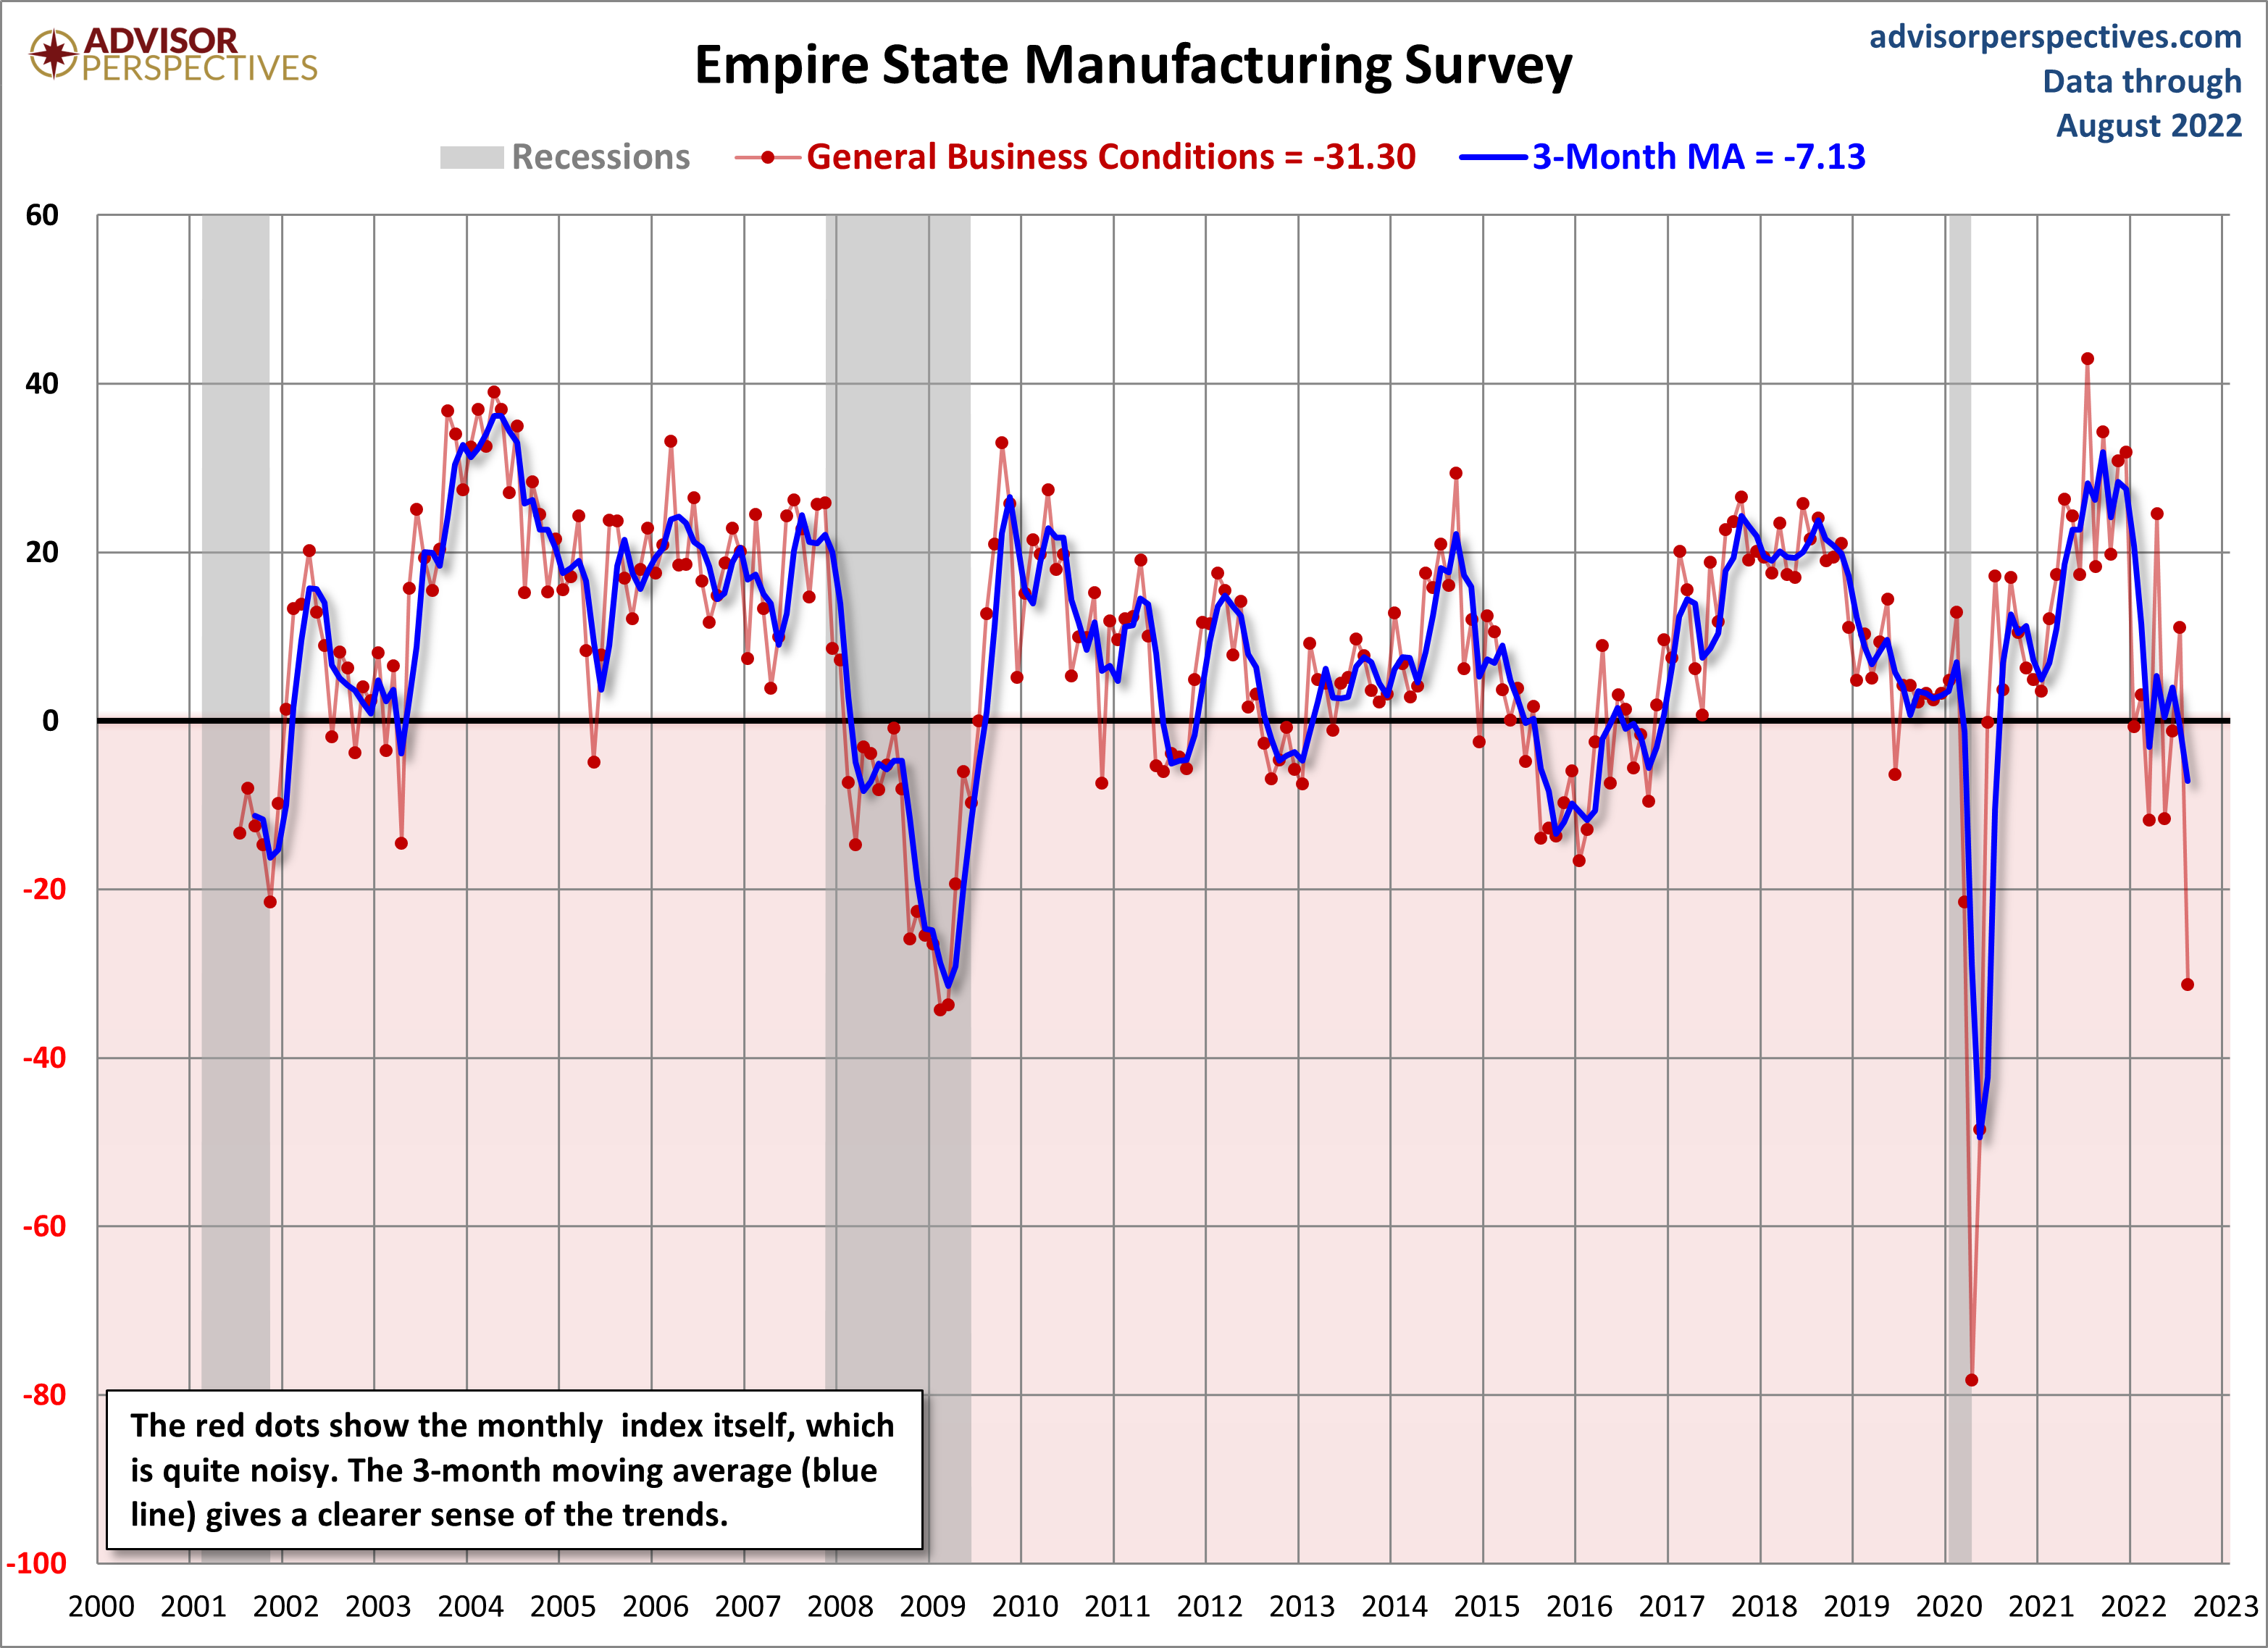
Since this survey only goes back to July of 2001, we only have two complete business cycles with which to evaluate its usefulness as an indicator for the broader economy. Following the Great Recession, the index has slipped into contraction multiple times, as the general trend slowed. We saw a gradual decline in 2015 that picked up in 2016, with a giant dip in 2020 due to COVID-19.
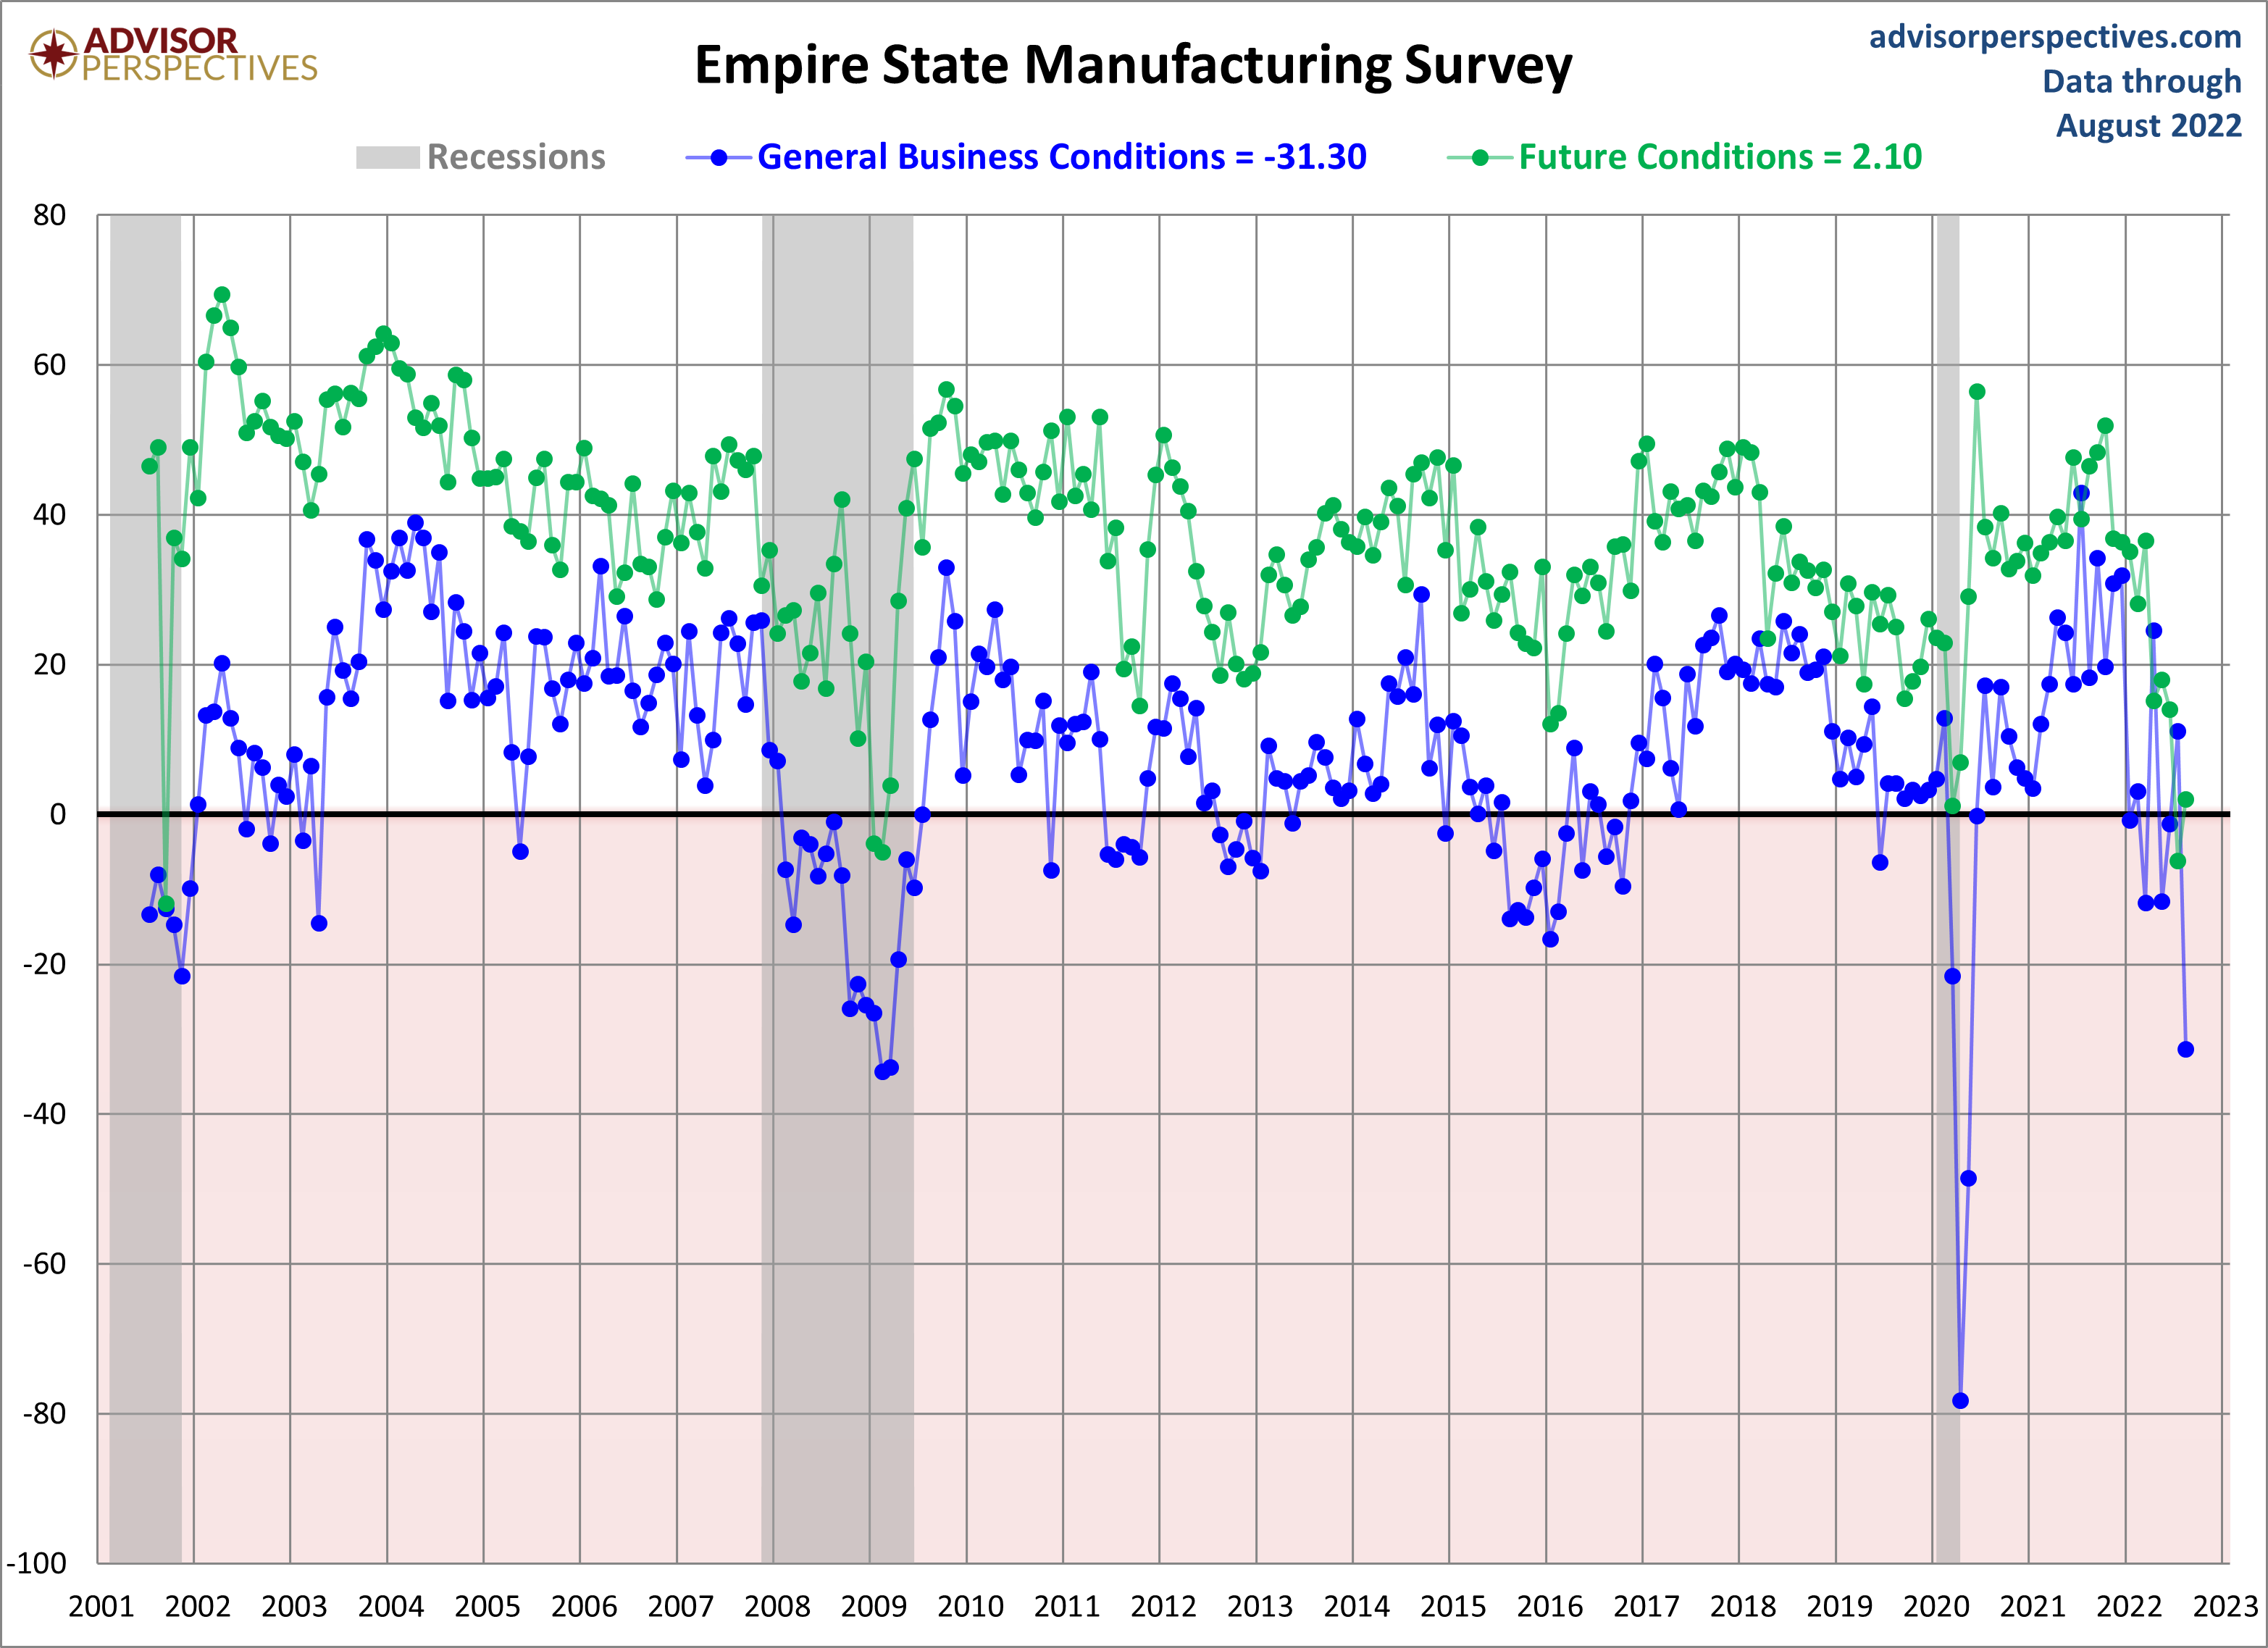
Here is an overlay of the current and future conditions (a six-month outlook).
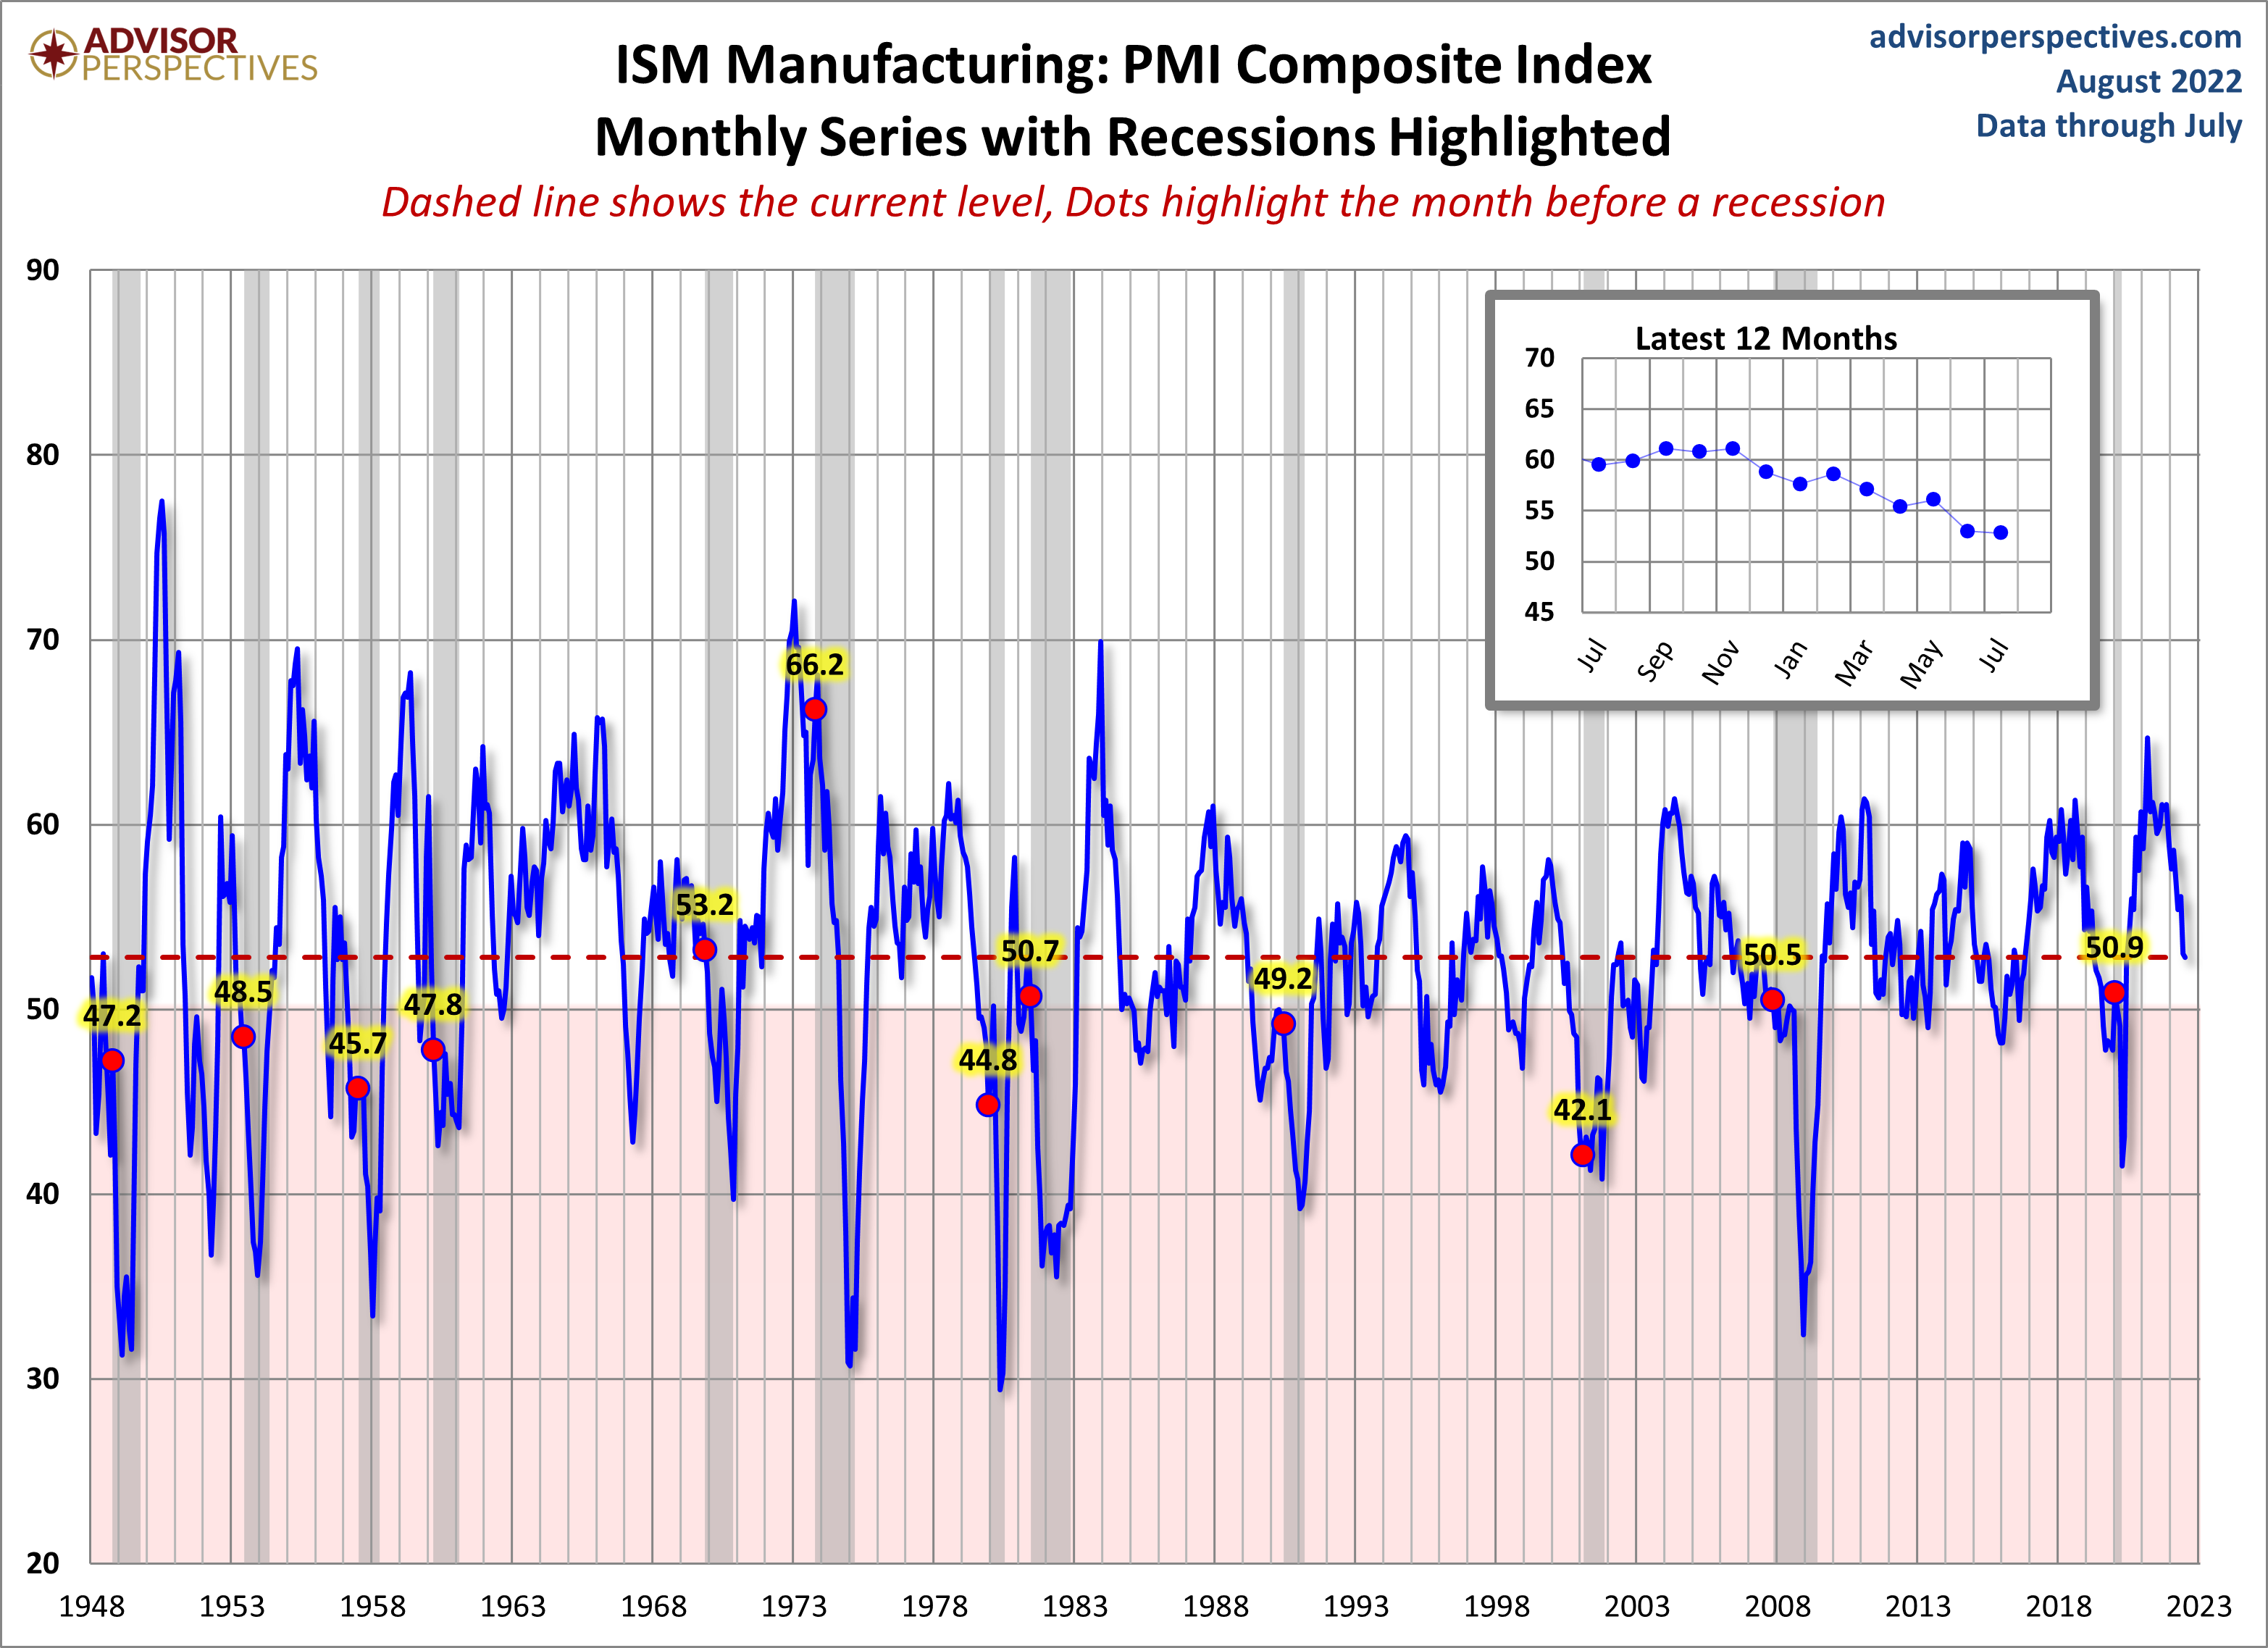
Meanwhile, here's another look at the latest ISM Manufacturing Business Activity Index.
Let's compare all five Regional Manufacturing indicators. Here is a three-month moving average overlay of each since 2001 (for those with data).
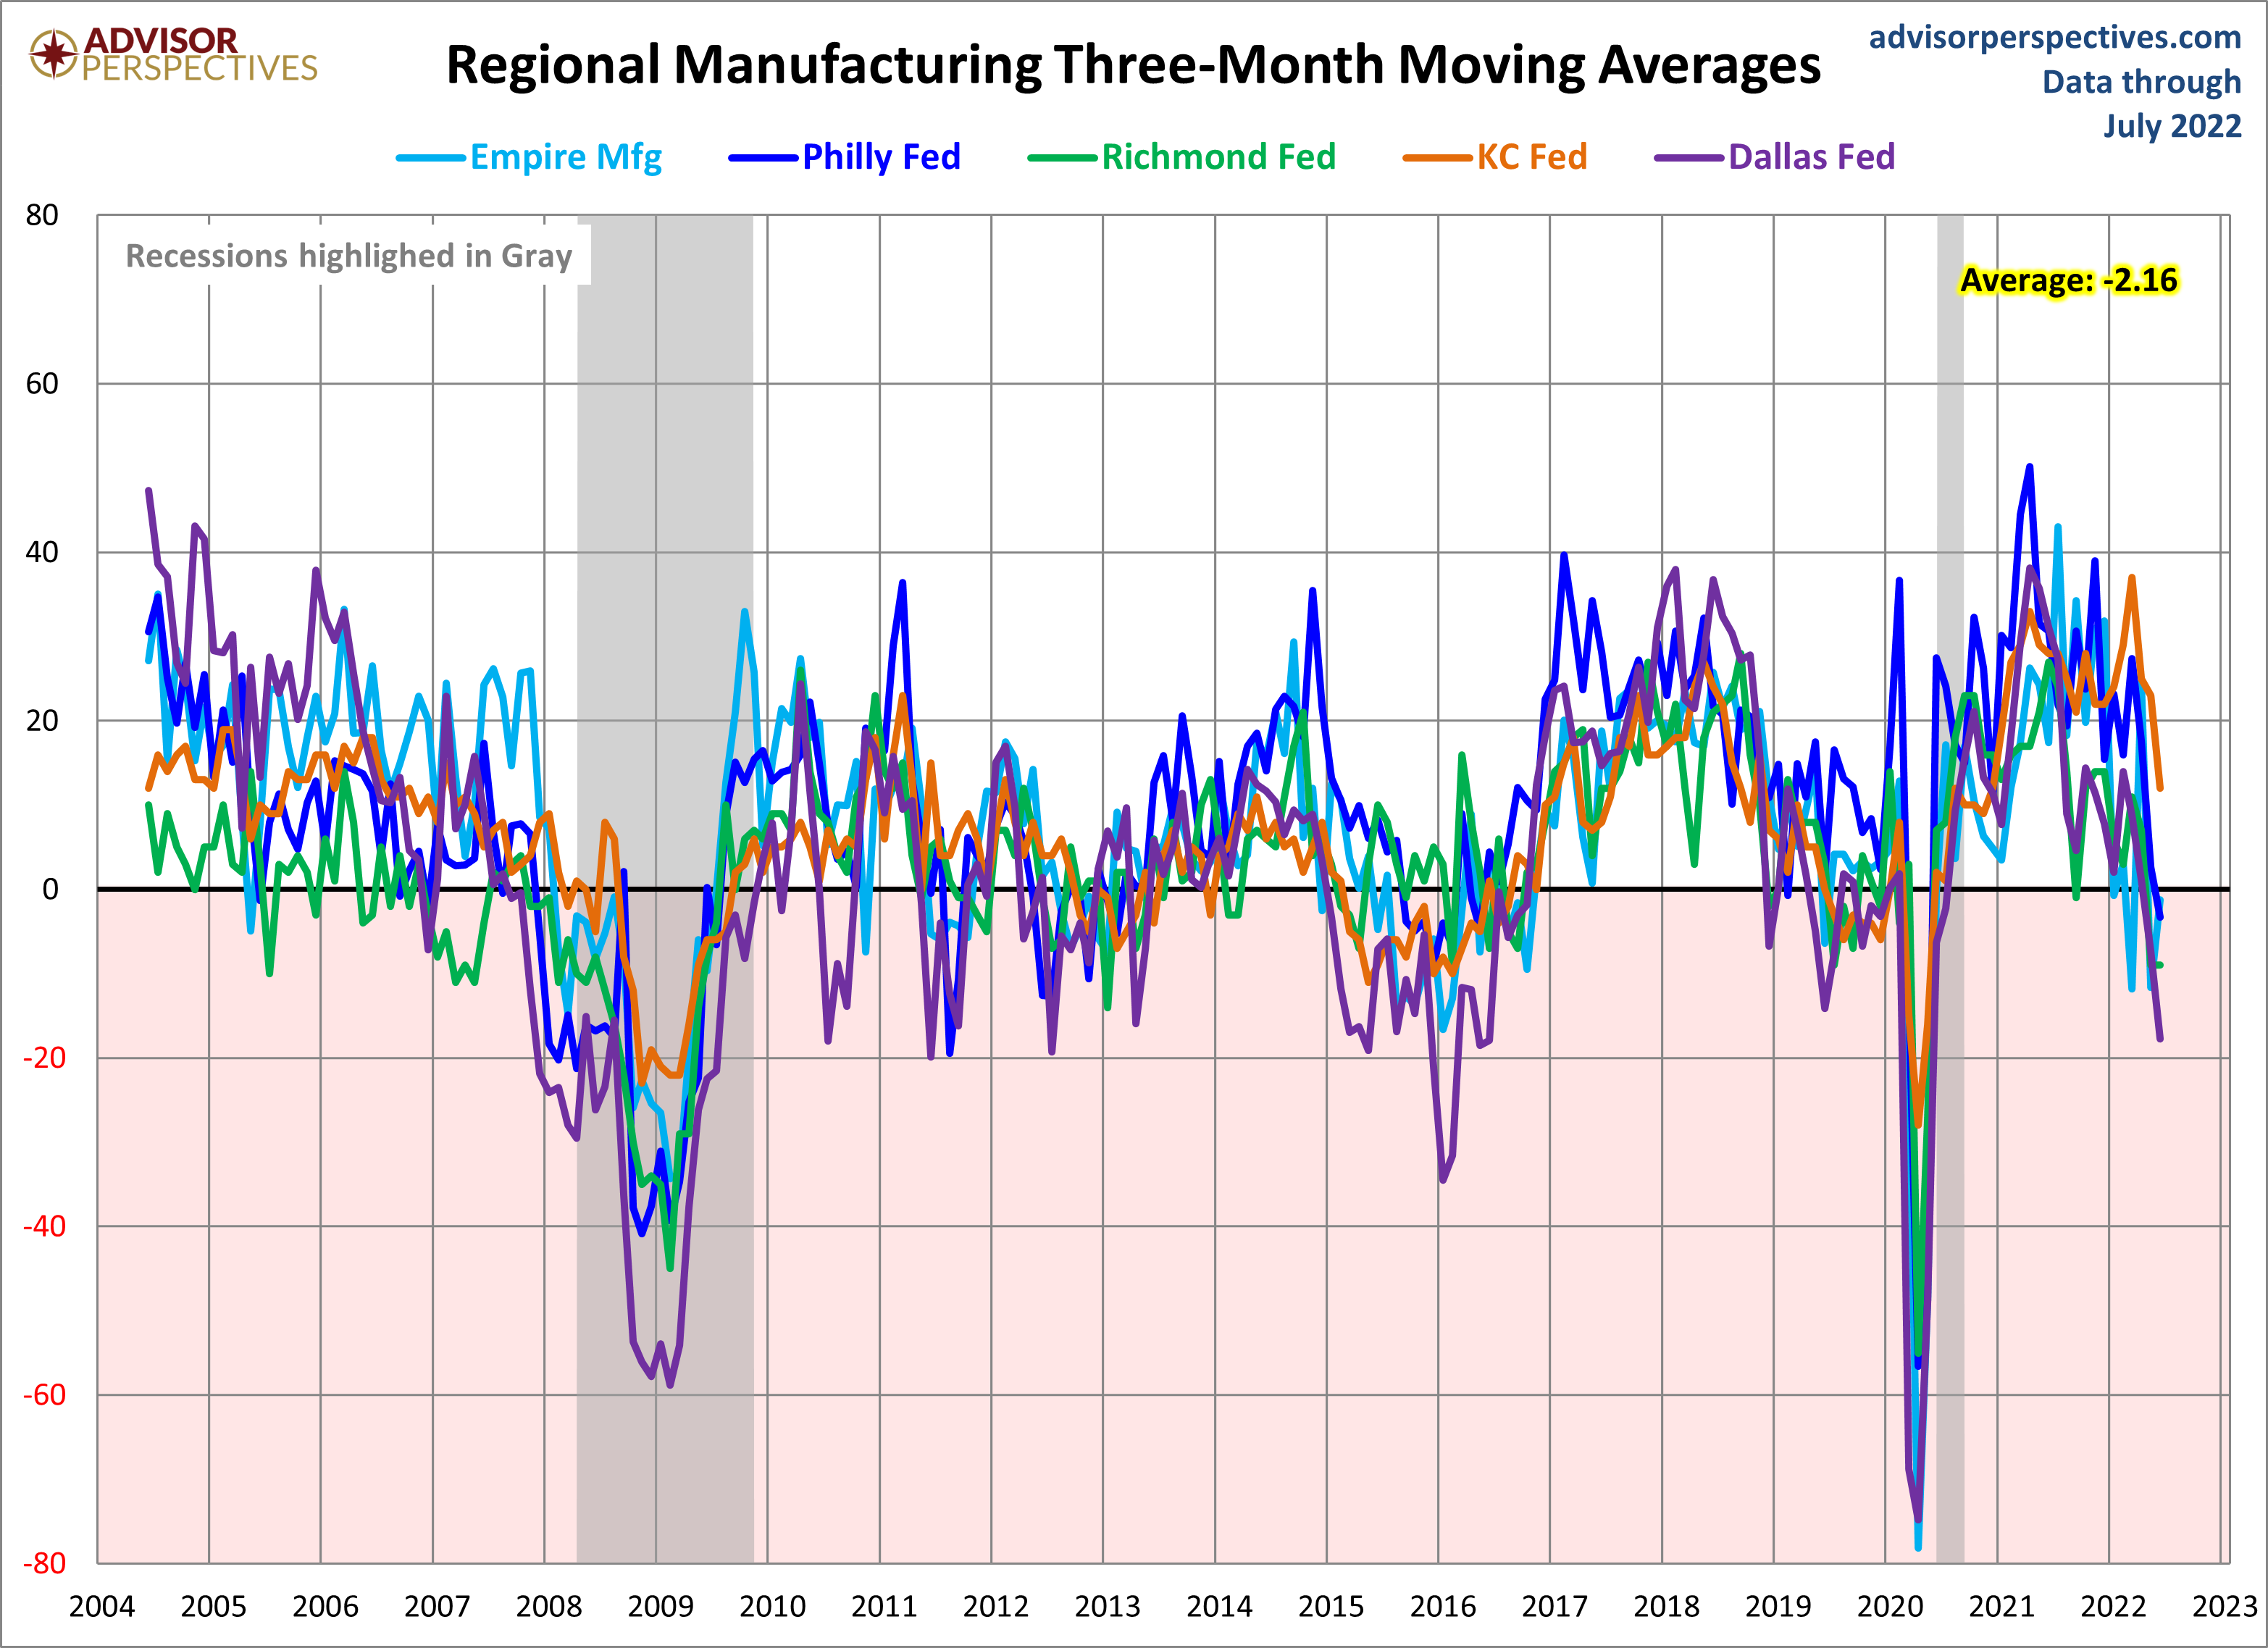
Here is the same chart including the average of the five. Readers will notice the range in expansion and contraction between all regions.

More By This Author:
Long-Term Trends In Employment By Age Group - Aug. 12th UpdateU.S. Workforce: July 2022 Update
The Civilian Labor Force, The Business Cycle And Unemployment Claims


Comments
Log in or sign up to join the conversation.