
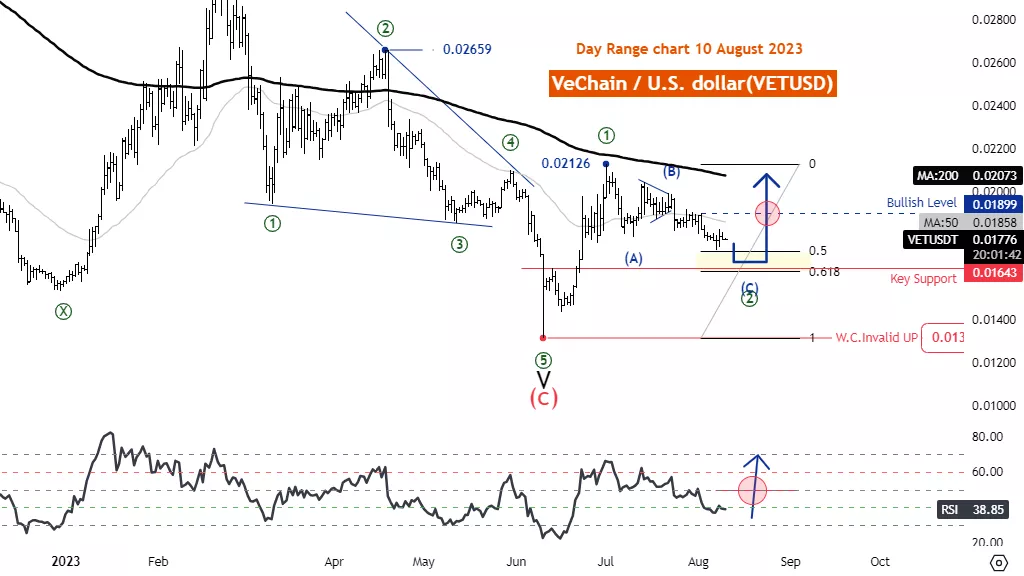
Elliott Wave Analysis TradingLounge Daily Chart, 10 August 23, Vechain/U.S. dollar(VETUSD) VETUSD Elliott Wave
Technical Analysis Function: Counter trend Mode:
Corrective Structure: Zigzag Position: Wave (B) Direction
Next higher Degrees: wave ((2)) of Impulse Wave Cancel invalid
Level: 0.01318
Details: Retracement of wave ((2)) usually .50 or .618 x Length wave ((1)) Vechain/U.S. dollar(VETUSD)
Trading Strategy: VeChain looks like the downtrend has ended at 0.01318 and is entering a new uptrend. With five waves extending in the upward direction. This leads us to predict the rise of wave ((1)), which is currently in the range of a correction in wave ((2)), with a Zigzag Retracement of wave ((2)) usually .50 or .618 x Length. wave ((1)), when wave ((2)) ends, the price has a chance to trade above the level of 0.02126. Vechain/U.S. dollar(VETUSD)Technical Indicators: The price is below the MA200 indicating a downtrend, RSI below 50 are Bearish momentum.
(Click on image to enlarge)
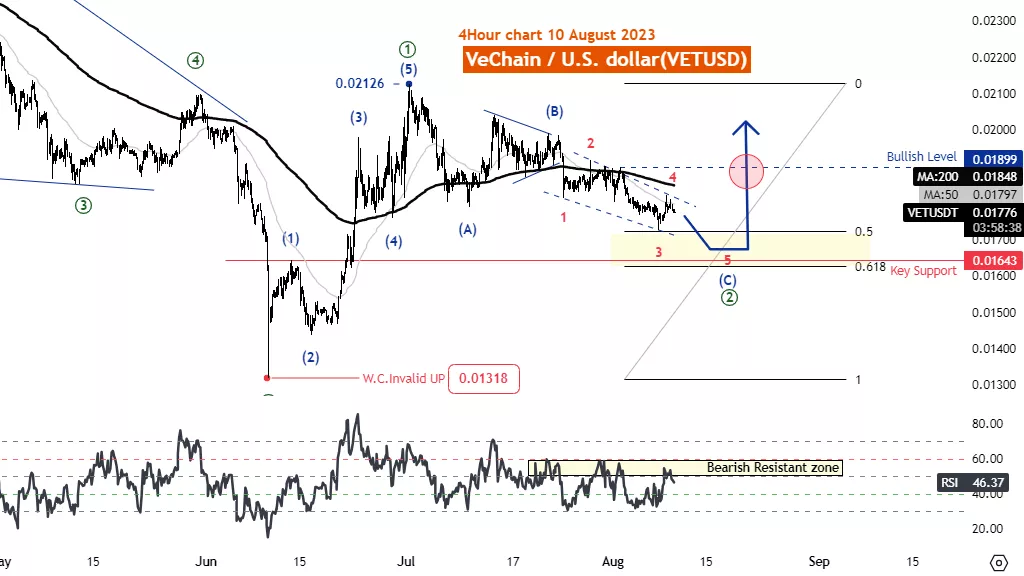
Elliott Wave Analysis TradingLounge 4H Chart, 10 August 23, Vechain/U.S. dollar(VETUSD) VETUSD Elliott Wave Technical Analysis Function: Counter trend Mode: Corrective Structure: Zigzag Position: Wave (B) Direction Next higher Degrees: wave ((2)) of Impulse Wave Cancel invalid Level: 0.01318 Details: Retracement of wave ((2)) usually .50 or .618 x Length wave ((1)) Vechain/U.S. dollar(VETUSD)Trading Strategy: VeChain looks like the downtrend has ended at 0.01318 and is entering a new uptrend. With five waves extending in the upward direction. This leads us to predict the rise of wave ((1)), which is currently in the range of a correction in wave ((2)), with a Zigzag Retracement of wave ((2)) usually .50 or .618 x Length. wave ((1)), when wave ((2)) ends, the price has a chance to trade above the level of 0.02126.
Vechain/U.S. dollar(VETUSD)Technical Indicators: The price is below the MA200 indicating a downtrend, RSI below 50 are Bearish momentum.
(Click on image to enlarge)
More By This Author:
Bitcoin Support At $30,000 Signals Potential Upswing: Elliott Wave Analysis
Elliott Wave Technical Analysis: Deere & Co. - Wednesday, August 9
Elliott Wave Technical Analysis: US Dollar/Swiss Franc - Wednesday, August 9


Comments
Log in or sign up to join the conversation.