

Photo by Austin Distel on Unsplash
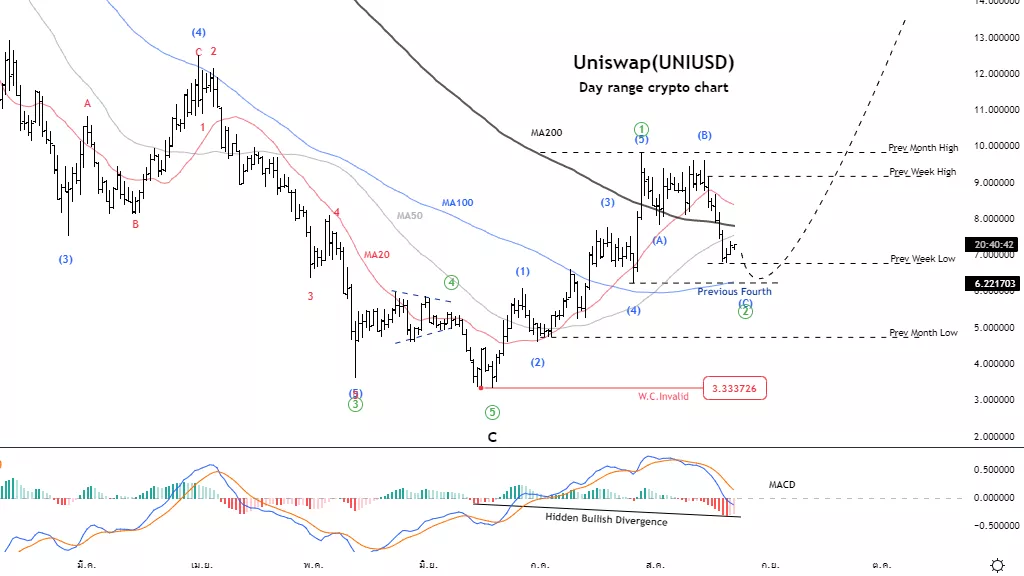
Elliott Wave Analysis TradingLounge Daily Chart, 22 August 2022, Uniswap(UNIUSD)
22 Monday, August 2022,02:17(UTC+1)London
UNIUSD Elliott Wave Technical Analysis
Function: Follow trend
Mode: Motive
Structure: Impulse
Position: Wave ((2))
Direction Next higher Degrees:
Details: reduction in wave ((2)) before are rising again in wave ((3)) Wave Cancel invalid Level: 3.333
Uniswap(UNIUSD) Trading Strategy: The decline to create this second wave could be an opportunity to join the trend again. Wait for the second wave to finish.
Uniswap(UNIUSD) Technical Indicators: Price has significant support at MA100, and MACD has a Hidden Bullish divergence signal.
Analyst: Kittiampon Somboonsod
(Click on image to enlarge)
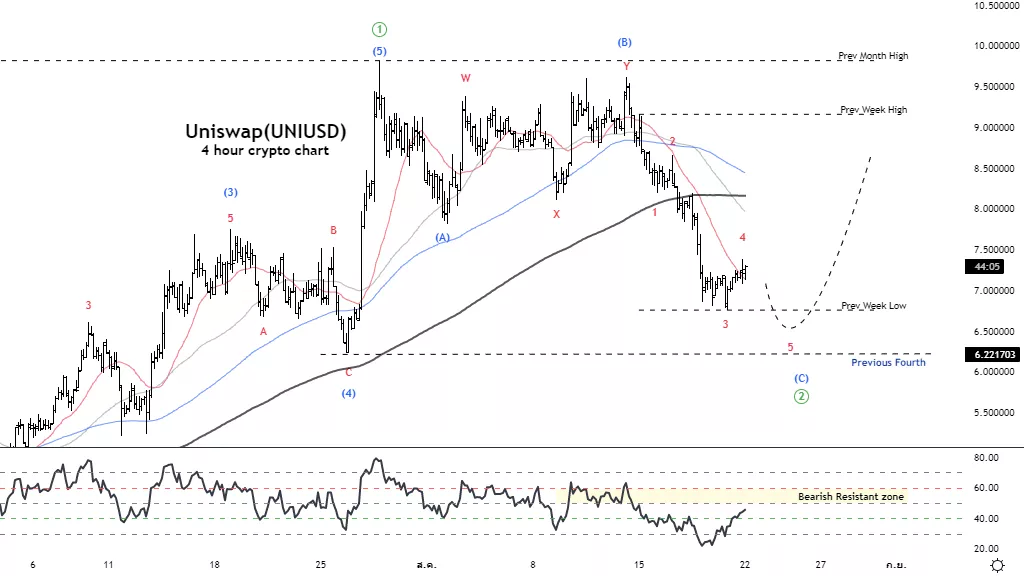
Elliott Wave Analysis TradingLounge 4H Chart, 22 August 2022, Uniswap(UNIUSD)
Monday 22 August 2022,02:16(UTC+1)London
UNIUSD Elliott Wave Technical Analysis
Function: Counter trend
Mode: Corrective
Structure: Flat
Position: Wave (C)
Direction Next higher Degrees: wave ((2)) of Motive Details: Decrease in wave (C). before increasing again Wave Cancel invalid Level :
Uniswap(UNIUSD) Trading Strategy: The decline to create this second wave could be an opportunity to join the trend again. Wait for the second wave to finish.
Uniswap(UNIUSD) Technical Indicators: The price is all below the MA line, indicating a downtrend. The RSI is moving into a bearish-resistant zone.
Short-term, there is a chance to drop again.
(Click on image to enlarge)
More By This Author:
Commodity Markets: Metals, Fuels, Energy - Elliott Wave View
Stock Market Daily News: Indices Still Have Room To Move Lower.
Elliott Wave Technical Analysis: Honeywell International Inc.


Comments
Log in or sign up to join the conversation.