Friday, August 19, 2022 10:09 AM EST
![red and blue light streaks](https://images.unsplash.com/photo-1611974789855-9c2a0a7236a3?ixlib=rb-1.2.1&ixid=MnwxMjA3fDB8MHxwaG90by1wYWdlfHx8fGVufDB8fHx8&auto=format&fit=crop&w=1000&q=80)
Photo by Maxim Hopman on Unsplash
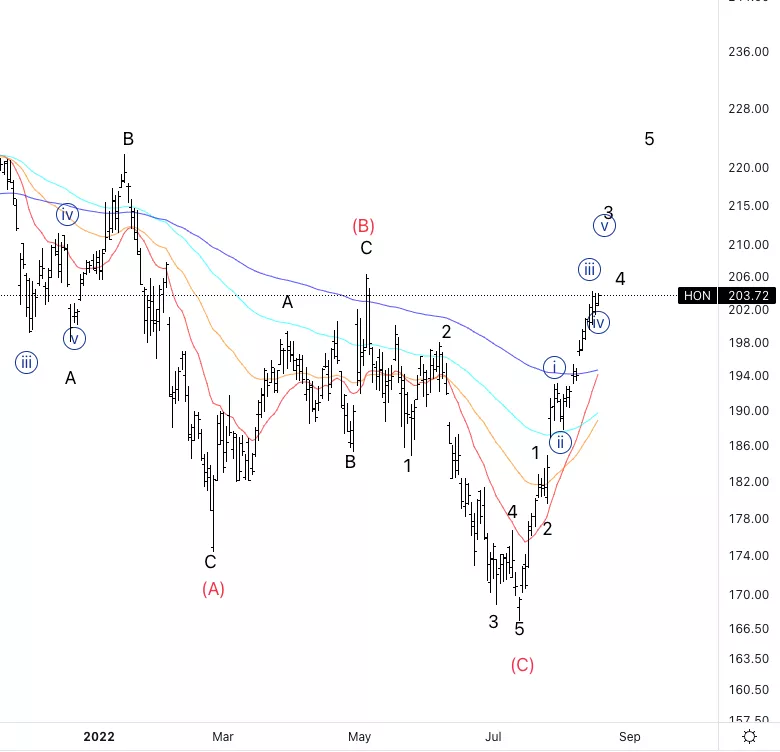
Honeywell International Inc.,(Nasdaq: HON): Daily Chart, August 19, 2022,
HON Stock Market Analysis: Looking for a resumption of the overall uptrend. The move of the low appears to be impulsive as we can count a potential five-wave move.
HON Elliott Wave count: {v} of 3.
HON Trading Strategy: Looking for a break of wave (b) on the left and then potentially the end of wave 4 to then set up longs.
HON Technical Indicators: Above all EMAs and starting to form RSI divergence.
Analyst: Alessio Barretta
(Click on image to enlarge)
![](https://talkmarkets.com/contributor/tradinglounge/user_content/ckimages/orig_hon_8_19.webp)
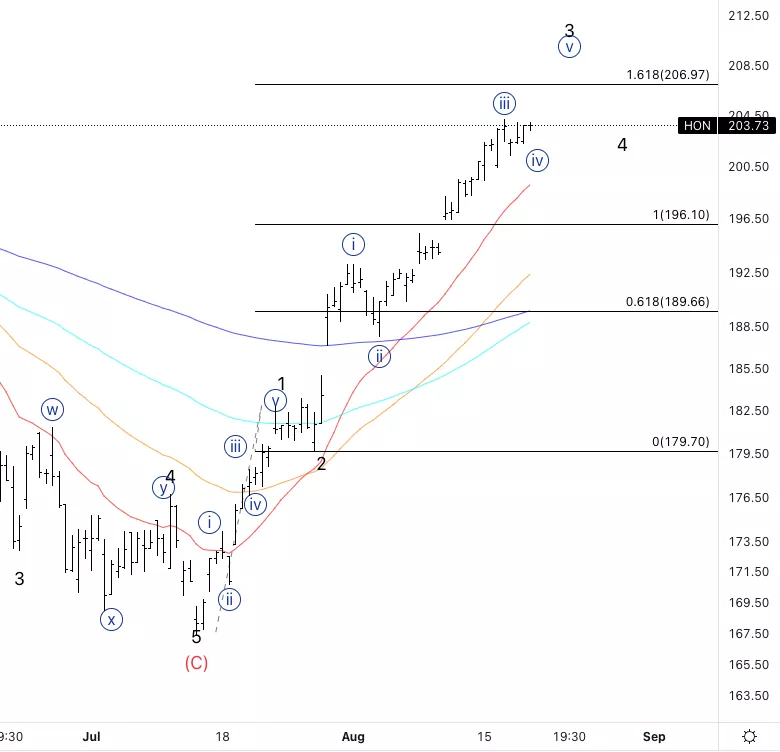
Honeywell International Inc., HON: 4-hour Chart, August 19, 2022,
Honeywell International Inc., Elliott Wave Technical Analysis
HON Stock Market Analysis: Looking for continuation higher, the 1.618 3vs 1 is at 207$ which represents the next target.
HON Elliott Wave count: Wave {v} of 3.
HON Technical Indicators: All technical indicators suggest further upside.
HON Trading Strategy: On short time frames every pullback should be supported therefore look for longs.
(Click on image to enlarge)
![](https://talkmarkets.com/contributor/tradinglounge/user_content/ckimages/orig_hon_4h.webp)
More By This Author:
U.S. Stocks Elliott Wave Analysis And Trading Strategies
Elliott Wave Technical Analysis: Texas Instruments Inc.
Elliott Wave Analysis: Dogecoin
Disclosure: As with any trading or investment opportunity there is a risk of making losses especially in day trading or investments that Trading Lounge expresses opinions on. Note: Historical ...
more
Disclosure: As with any trading or investment opportunity there is a risk of making losses especially in day trading or investments that Trading Lounge expresses opinions on. Note: Historical trading results are no guarantee of future returns. Some investments are inherently more risky than others. At worst, you could lose your entire investment and more TradingLounge™ uses a range of technical analysis tools, such as Elliott Wave, software and basic fundamental analysis as well as economic forecasts aimed at minimising the potential for loss. The advice we provide through our TradingLounge™ websites and our TradingLounge™ Membership has been prepared without taking into account your particular objectives, financial situation or needs. Reliance on such advice, information or data is at your own risk. The decision to trade and the method of trading is for you alone to decide, tradinglounge takes no responsibility whatsoever for your trading profits or losses. This information is of a general nature only, so you should, before acting upon any of the information or advice provided by us, consider the appropriateness of the advice in light of your own objectives, financial situation or needs. Therefore, you should consult your financial advisor or accountant to determine whether trading in Indices Stocks shares Forex CFDs Options Spread Betting derivatives of any kind / products is appropriate for you in light of your financial trading circumstances.
less
How did you like this article? Let us know so we can better customize your reading experience.