
Elliott Wave Technical Analysis: TRON/U.S. Dollar - Tuesday, Aug. 22

Image Source: Freepik
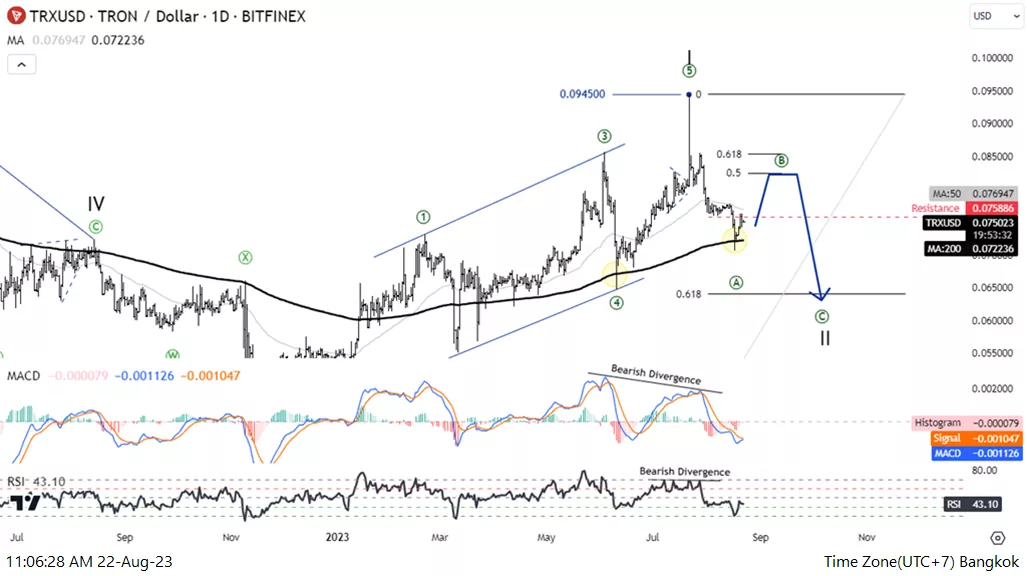
Elliott Wave Analysis TradingLounge Daily Chart, 22 August 2023.
TRON/U.S. Dollar(TRXUSD)
TRXUSD Elliott Wave Technical Analysis
Function: Counter Trend
Mode: Corrective
Structure: Flat
Position: Wave((C))
Direction Next higher Degrees: wave II of Motive
Wave Cancel invalid level:
TRON/U.S. Dollar(TRXUSD) Trading Strategy: Tron recovered well maybe the MA200 line, but even then, the fall from 0.094 with a five-wave pattern led us to expect the rise from the MA200 to be just a short-term rise to continue down. So all of them are zigzag corrections.
TRON/U.S. Dollar(TRXUSD) Technical Indicators: The price is above the MA200 indicating an Uptrend, MACD, and RSI have Bullish divergence.
Analyst: Kittiampon Somboonsod, CEWA
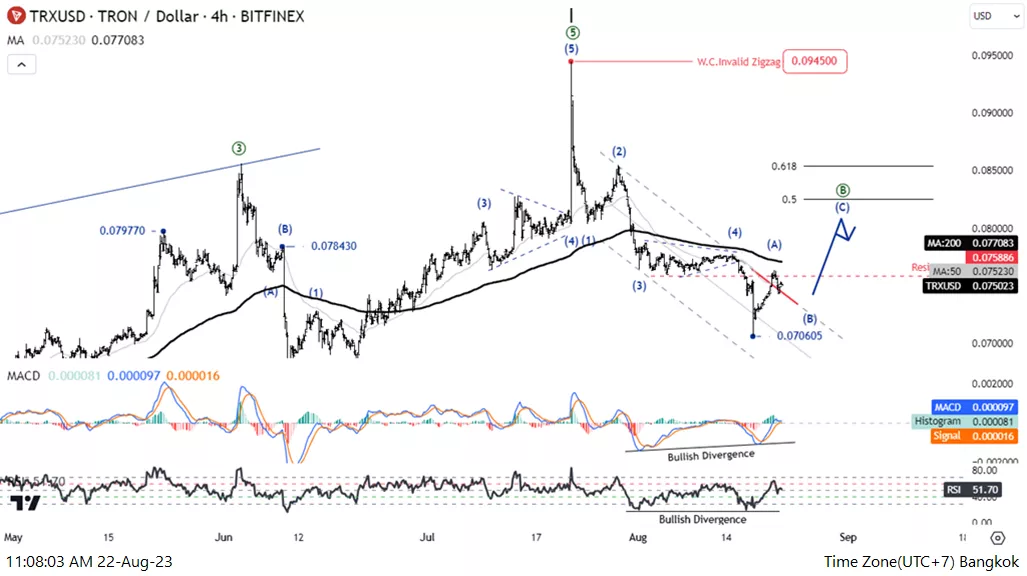
Elliott Wave Analysis TradingLounge 4H Chart, 22 August 2023.
TRON/U.S. Dollar(TRXUSD) TRXUSD
Elliott Wave Technical Analysis Function: Counter
Trend Mode: Corrective
Structure: Flat
Position: Wave((C))
Direction Next higher Degrees: wave II of Motive
Wave Cancel invalid level:
TRON/U.S. Dollar(TRXUSD) Trading Strategy: Tron recovered well maybe the MA200 line, but even then, the fall from 0.094 with a five-wave pattern led us to expect the rise from the MA200 to be just a short-term rise to continue down. So all of them are zigzag corrections.
TRON/U.S. Dollar(TRXUSD) Technical Indicators: The price is above the MA200 indicating an uptrend. MACD and RSI have Bearish divergence.
More By This Author:
Global Stock Indices - Elliott Wave Technical Analysis
Elliott Wave Technical Analysis Day Chart: Australian Dollar/Japanese Yen - Monday, Aug. 21
Elliott Wave Technical Analysis 4 Hour Chart: Australian Dollar/Japanese Yen - Monday, Aug. 21
Analyst Peter Mathers TradingLounge™ Australian Financial Services Licence - AFSL 317817


