Elliott Wave Technical Analysis: Polkadot, Thursday, Sept. 7
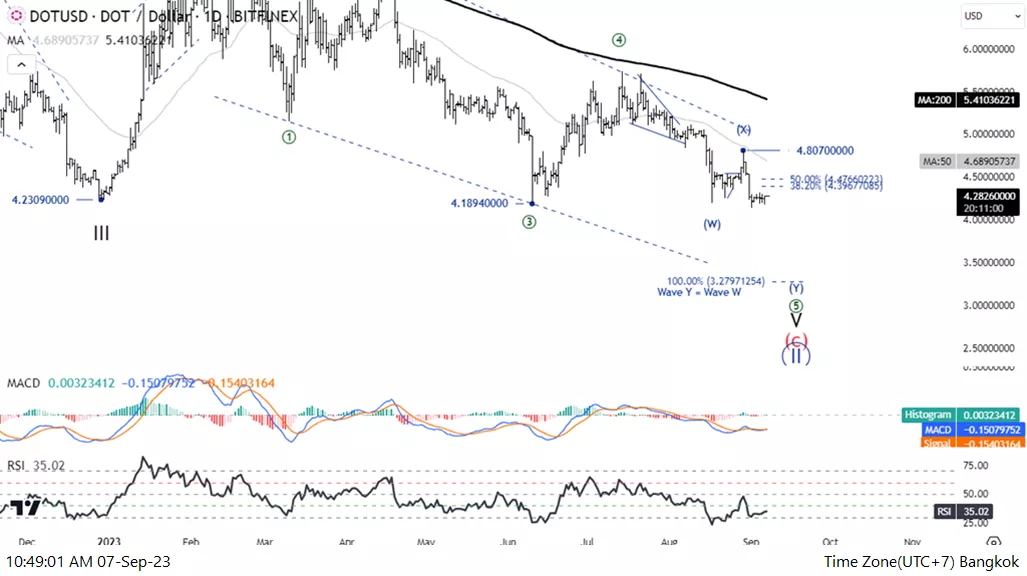
Elliott Wave Analysis TradingLounge Daily Chart, Thursday, September 7
Polkadot/U.S. dollar (DOT-X)
DOTUSD Elliott Wave Technical Analysis
Function: counter Trend
Mode: Corrective
Structure: Zigzag
Position: Wave B
Direction Next higher Degrees: wave (Y) of Double Corrective
Wave Cancel invalid level: 4.20
Details: We still want two moved so that Zigzag is complete
Polkadot/U.S.Dollar (DOTUSD) Trading Strategy: The continuing downtrend in Wave ((5)) of the Diagonal Pattern, which has a trend falling to 3.279, Also the price below MA200 makes it appear to be pressured by sales, so we still look find a move downwards.
Polkadot/U.S.Dollar (DOTUSD) Technical Indicators: The price is below the MA200 indicating a downtrend, MACD and RSI bearish momentum.
TradingLounge Analyst: Kittiampon Somboonsod, CEWA

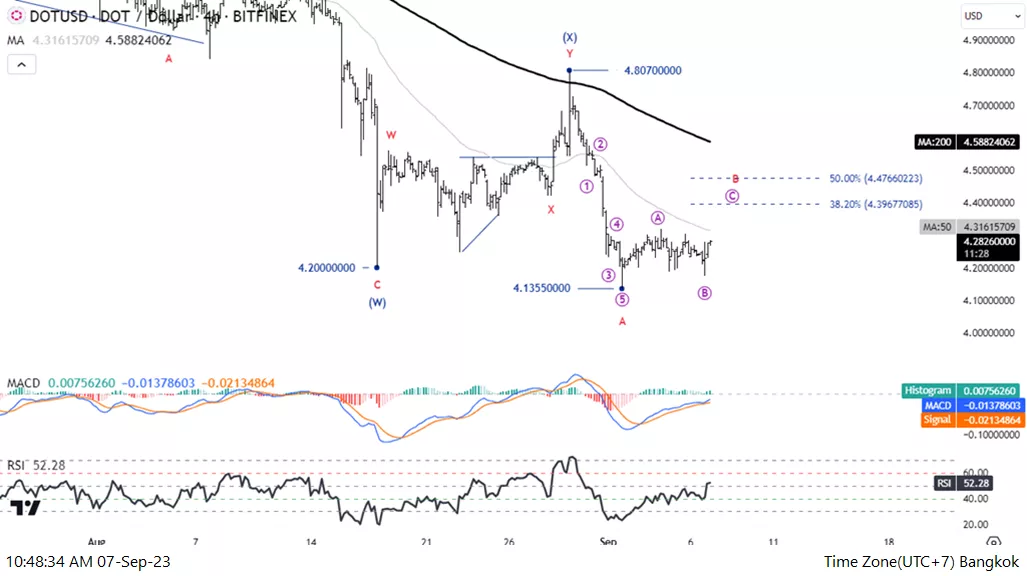
Elliott Wave Analysis TradingLounge 4H Chart, Thursday, September 7.
Polkadot/U.S.Dollar (DOTUSD)
DOTUSD Elliott Wave Technical Analysis
Function: counter Trend
Mode: Corrective
Structure: Zigzag
Position: Wave B
Direction Next higher Degrees: wave (Y) of Double Corrective
Wave Cancel invalid level: 4.20
Details: We still want two moved so that Zigzag is complete
Polkadot/U.S.Dollar (DOTUSD) Trading Strategy: The Corrective of Zigzag. We still want two moves for a Zigzag completion which could be seen in the rising of wave B and falling in wave C, so the outlook still a downtrend and the price has a trend fall below 4.1355
Polkadot/U.S.Dollar (DOTUSD) Technical Indicators: The price is below the MA200 indicating a Downtrend, MACD and RSI bearish momentum.

More By This Author:
Market Update On Key Indices
Elliott Wave Technical Analysis: Zscaler Inc. - Wednesday, Sept. 6
Elliott Wave Technical Analysis 4 Hour Chart: New Zealand Dollar/U.S. Dollar - Tuesday, Sept. 5
Analyst Peter Mathers TradingLounge™ Australian Financial Services Licence - AFSL 317817


