

Photo by Austin Distel on Unsplash
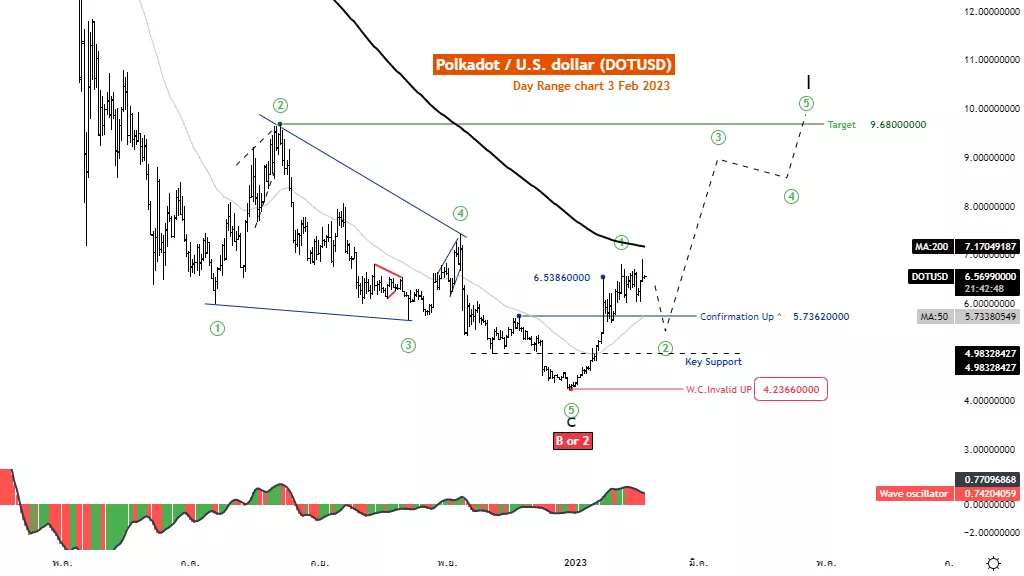
Elliott Wave Analysis TradingLounge Daily Chart, 3 February 2023
Polkadot /U.S.Dollar (DOTUSD)
DOTUSD Elliott Wave Technical Analysis
Function: Follow trend
Mode: Motive
Structure: Impulse
Position: Wave ((1))
Direction Next higher Degrees: wave I of Motive
Wave Cancel invalid level: 4.23
Polkadot /U.S. Dollar (DOTUSD) Trading Strategy: The rise of the first wave is in an uptrend, upon completion, the price will retrace again in the second wave, but must not retrace more than 100% of the first wave. Gives us the opportunity to join the trend again. Wait for the second wave to finish.
Polkadot /U.S. Dollar (DOTUSD) Technical Indicators: The price is below the MA200 indicating a downtrend. The wave oscillators above Zero-Line momentum are bullish.
Analyst: Kittiampon Somboonsod
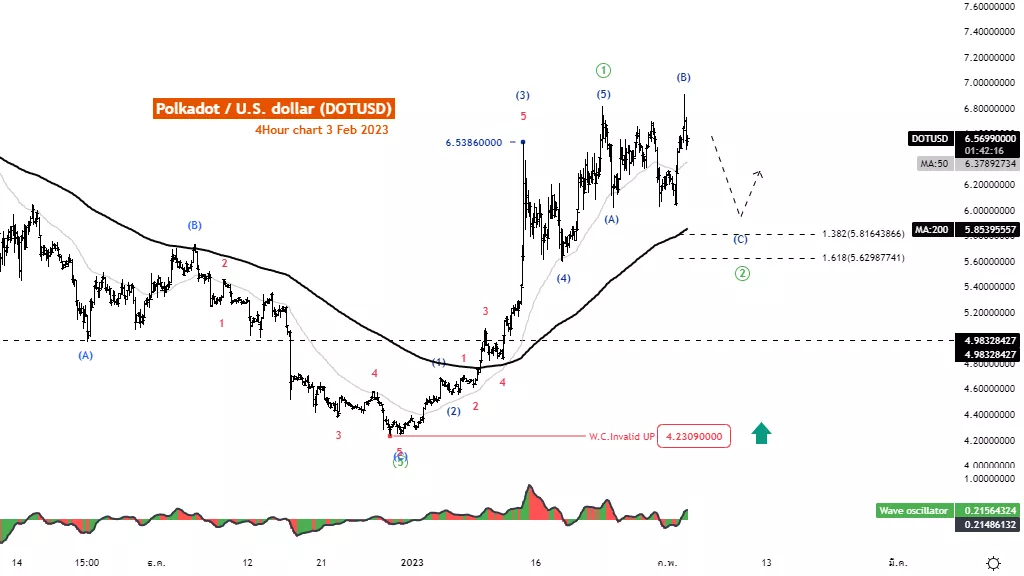
Elliott Wave Analysis TradingLounge 4H Chart, 3 February 2023
Polkadot /U.S. Dollar (DOTUSD)
DOTUSD Elliott Wave Technical Analysis
Function: Counter trend
Mode: Corrective
Structure: Flat
Position: Wave (C)
Direction Next higher Degrees: wave I of Motive
Wave Cancel invalid level: 4.23
Polkadot /U.S. Dollar (DOTUSD) Trading Strategy: The rise of the first wave is in an uptrend, upon completion, the price will retrace again in the second wave, but must not retrace more than 100% of the first wave. Gives us the opportunity to join the trend again. Wait for the second wave to finish.
Polkadot /U.S. Dollar (DOTUSD) Technical Indicators: The price is above the MA200, indicating an uptrend. The wave oscillators above Zero-Line Bullish momentum.
More By This Author:
Elliott Wave Count On Nasdaq Stocks - Low In Place
Elliott Wave Technical Analysis: Spotify Technology S.A.
Elliott Wave Technical Analysis: NEO / U.S. Dollar


Comments
Log in or sign up to join the conversation.