

Image Source: Unsplash
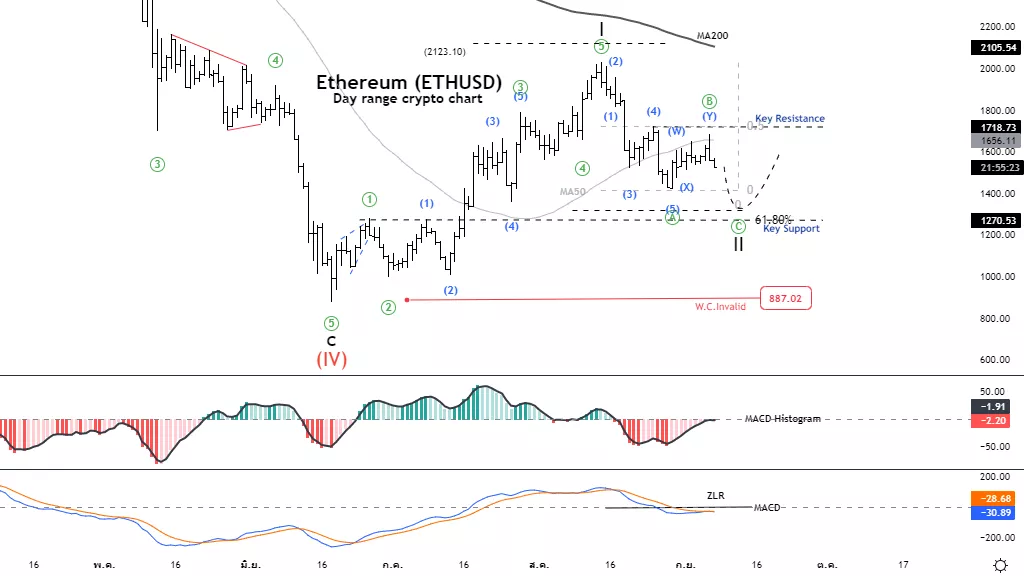
Elliott Wave Analysis TradingLounge Daily Chart, 7 September 2022, Ethereum(ETHUSD)
ETHUSD Elliott Wave Technical Analysis
Function: Counter trend
Mode: Corrective
Structure: Zigzag
Position: Wave A
Direction Next higher Degrees: Impulse wave (II) Details: A decrease in wave ((A)) first increases in wave ((B)) and decreases again in wave ((C)).
Wave Cancel invalid Level: 887.02
Ethereum(ETHUSD) Trading Strategy: The price range tends to test resistance at MA50 Line and continue downward in wave C, providing a short-term trading opportunity in the downtrend.
Ethereum(ETHUSD) Technical Indicators: MACD Line cross Signal Line at Zero line is a Reversal signal
Analyst: Kittiampon Somboonsod
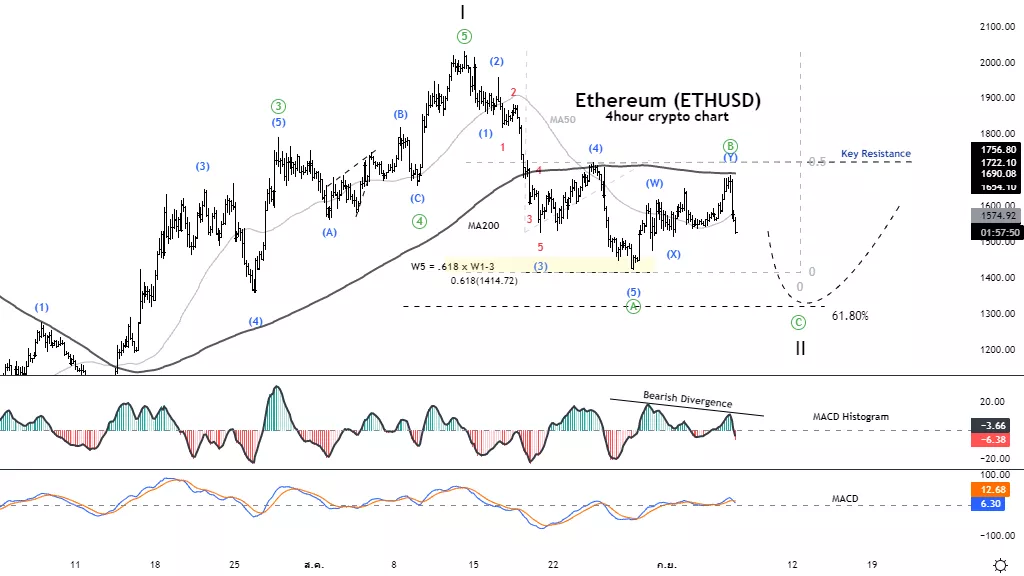
Elliott Wave Analysis TradingLounge 4H Chart, 7 September 2022, Ethereum(ETHUSD)
AAVEUSD Elliott Wave Technical Analysis
Function: Counter trend
Mode: Corrective
Structure: Zigzag
Position: Wave ((B))
Direction Next higher Degrees: Wave II of Motive Details: The rise of wave ((B)), upon completion, the price will fall again on wave ((C)).
Wave Cancel invalid Level: 45.770757
Ethereum(ETHUSD) Trading Strategy: The price range tends to test resistance at MA200 Line and continue downward in wave C, providing a short-term trading opportunity in the downtrend.
Ethereum(ETHUSD) Technical Indicators: MACD Histogram has a Bearish divergence, the price has opportunity reversal
More By This Author:
SP500 Elliott Wave Analysis: Wave (iii) Of V)
Elliott Wave Technical Analysis: AAVE Token (AAVEUSD)
Shorting The Australian Stock Market Today


Comments
Log in or sign up to join the conversation.