
Elliott Wave Technical Analysis Dogecoin Crypto Price News Today
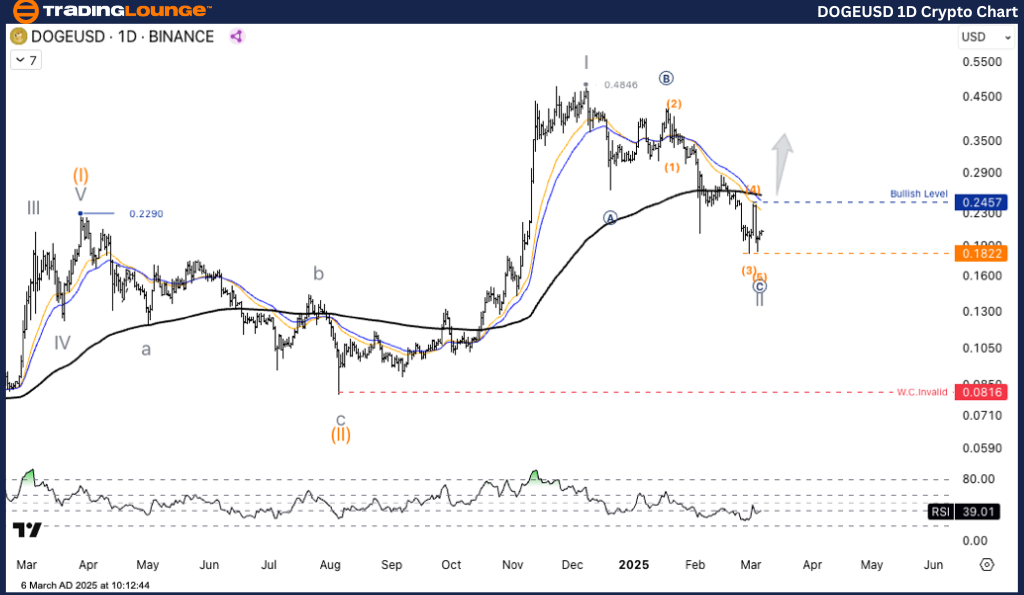
Elliott Wave Analysis - TradingLounge Daily Chart
Dogecoin/ U.S. Dollar (DOGEUSD)
DOGEUSD Elliott Wave Technical Analysis
- Function: Counter Trend
- Mode: Corrective
- Structure: Flat
- Position: Wave C
- Next Higher Degree Direction: Wave (III) of Impulse
- Wave Cancellation Invalid Level:
- Details: Wave C correction is in progress before the price resumes its uptrend. A reversal signal is awaited.
Dogecoin/ U.S. Dollar (DOGEUSD) Trading Strategy
Dogecoin (DOGE) is entering a crucial phase. Following an extended correction, the price is now nearing the end of Wave (II) based on Elliott Wave Theory, which may present new trading opportunities.
- 0.1822 - Key Support Level: If the price falls below this level, it may indicate a continued downtrend.
- 0.2457 - Key Resistance Level: If the price breaks above this level, it may confirm the start of an uptrend.
- 0.4846 - Long-Term Target: If the uptrend resumes, this could be a potential price target.
Trading Strategies
Strategy
- Long Strategy
- Pullback Entry: Buy when the price drops to the critical support level.
- If the price holds above 0.1822 and rebounds, traders might consider entering long positions.
Risk Management
- If the price drops below 0.1822, traders should wait for a clearer reversal signal before making a move.
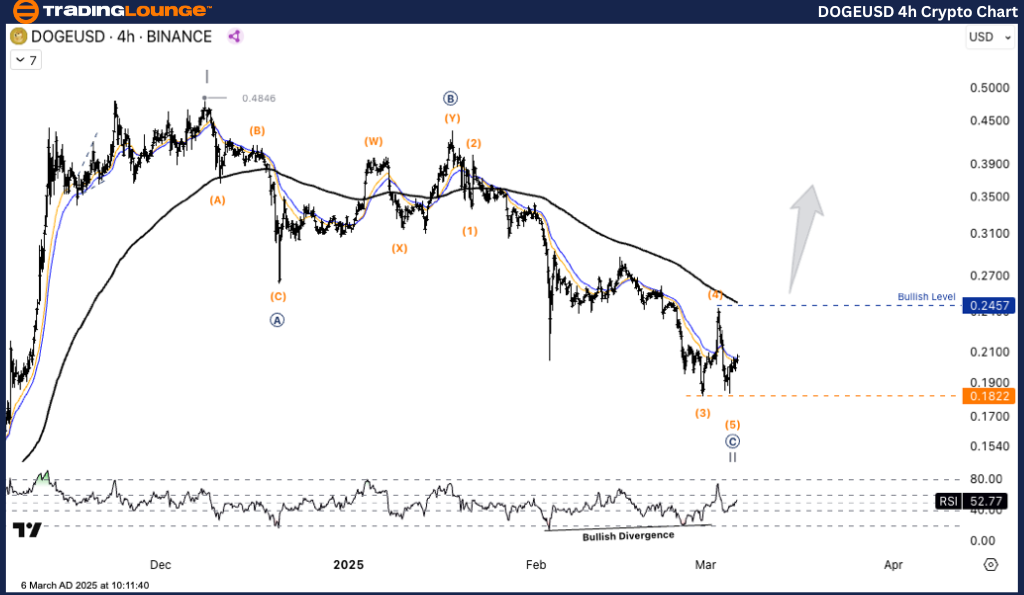
Elliott Wave Analysis - TradingLounge H4 Chart
Dogecoin/ U.S. Dollar (DOGEUSD)
DOGEUSD Elliott Wave Technical Analysis
- Function: Counter Trend
- Mode: Corrective
- Structure: Flat
- Position: Wave C
- Next Higher Degree Direction: Wave (III) of Impulse
- Wave Cancellation Invalid Level:
- Details: Wave C correction is in progress before the price resumes its uptrend. A reversal signal is awaited.
Dogecoin/ U.S. Dollar (DOGEUSD) Trading Strategy
Dogecoin (DOGE) is in an important phase. After a prolonged correction, the price is now nearing the completion of Wave (II) under Elliott Wave Theory, potentially creating new trading opportunities.
- 0.1822 - Key Support Level: A break below this level may signal further downside movement.
- 0.2457 - Key Resistance Level: If the price surpasses this level, it could confirm an uptrend.
- 0.4846 - Long-Term Target: If the uptrend continues, this could be a future price target.
Trading Strategies
Strategy
- Long Strategy
- Pullback Entry: Buy when the price dips to the crucial support level.
- If the price remains above 0.1822 and rebounds, traders may consider long positions.
Risk Management
- If the price moves below 0.1822, waiting for a clearer reversal signal is advisable.
TradingLounge Analyst: Kittiampon Somboonsod, CEWA
More By This Author:
Elliott Wave Insights: Trading Strategies For S&P 500, Nasdaq 100, DAX 40, FTSE 100 & ASX 200
Elliott Wave Analysis: Macquarie Group Limited
Elliott Wave Technical Analysis MicroStrategy Inc.
At TradingLounge™, we provide actionable Elliott Wave analysis across over 200 markets. Access live chat rooms, advanced AI & algorithmic charting tools, and curated trade ...
more

