

Image Source: Unsplash
MicroStrategy Inc. (MSTR) – Elliott Wave Analysis – Trading Lounge Daily Chart
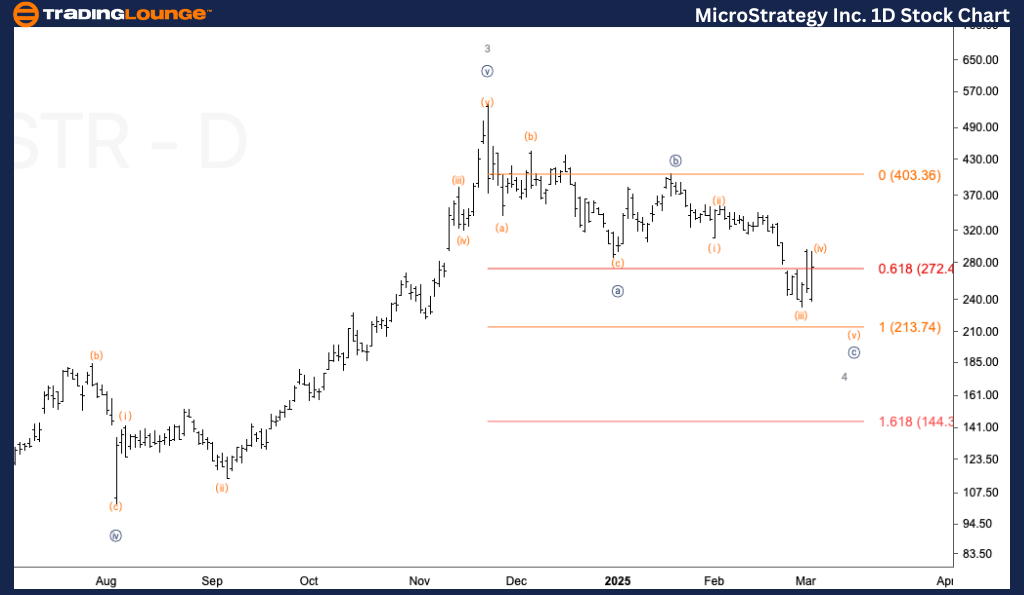
MSTR Elliott Wave Technical Analysis
- Function: Counter Trend
- Mode: Corrective
- Structure: Flat
- Position: Wave {c} of 4
- Direction: Downside in Wave {c}
- Details: Expecting a continuation lower in Wave {c}, with an ideal target at $213, aligning with a potential retest of Trading Level 2 at $200.
MicroStrategy Inc. (MSTR) – Elliott Wave Analysis – Trading Lounge 1-Hour Chart
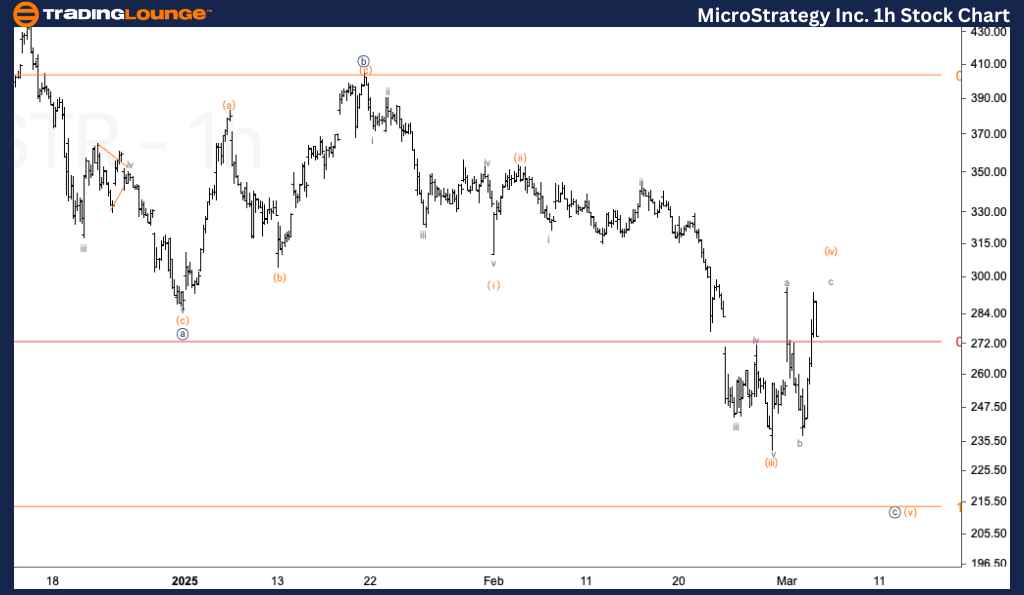
MSTR Elliott Wave Technical Analysis
- Function: Counter Trend
- Mode: Corrective
- Structure: Flat
- Position: Wave (iv) of {c}
- Direction: Downside in Wave (v) of {c}
- Details:
- Currently in the final stages of Wave (iv).
- Possible continuation sideways, forming a triangle or complex correction.
- As long as MSTR trades below $300, further downside in Wave (v) of {c} is expected.
Summary
This analysis examines MicroStrategy Inc. (MSTR) using Elliott Wave Theory on both the daily and 1-hour charts, identifying key market trends and potential movements.
- On the daily chart, Wave {c} is expected to reach $213, potentially testing Trading Level 2 at $200, which may act as support.
- On the 1-hour chart, Wave (iv) is near completion, with a likely continuation below $300 before Wave (v) of {c} completes.
Traders should monitor these key levels for potential confirmations or reversals.
Technical Analyst: Alessio Barretta
More By This Author:
Elliott Wave Analysis: Macquarie Group Limited
Elliott Wave Technical Analysis: U.S. Dollar/Canadian Dollar - Wednesday, March 5
Elliott Wave Technical Analysis - Cardano Crypto News Today


Comments
Log in or sign up to join the conversation.