

Image Source: Freepik
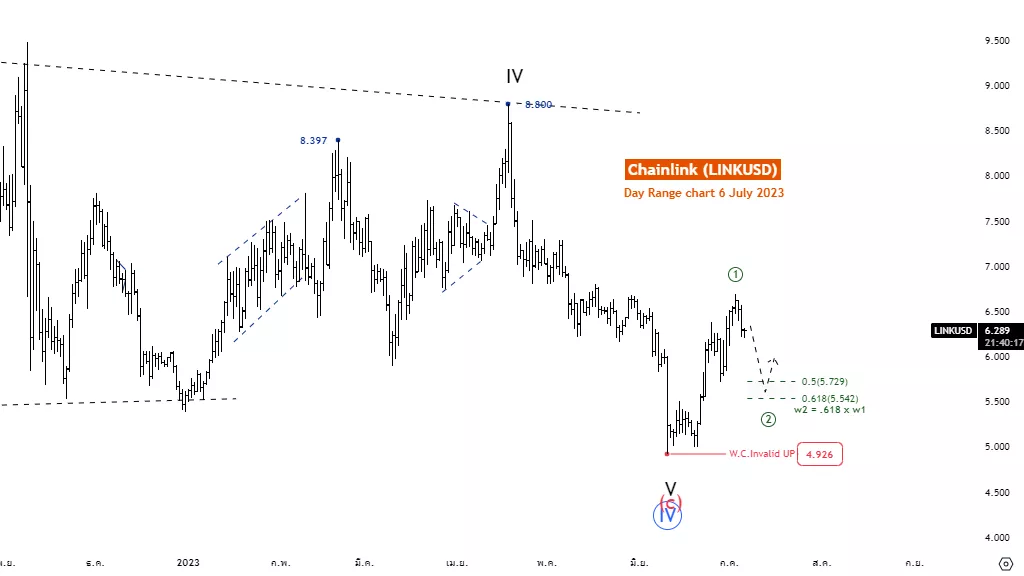
LINKUSD Day Crypto Chart
Thursday 6 July 2023.
LINKUSD Elliott Wave Technical Analysis
Function: Follow trend
Mode: Motive
Structure: Impulse
Position: Wave V
Direction Next higher Degrees: Wave V of Zigzag
Details: Wave V is likely to end at the 4.926 level and a five-wave rise will confirm this idea.
Wave Cancel invalid Level: 4.926
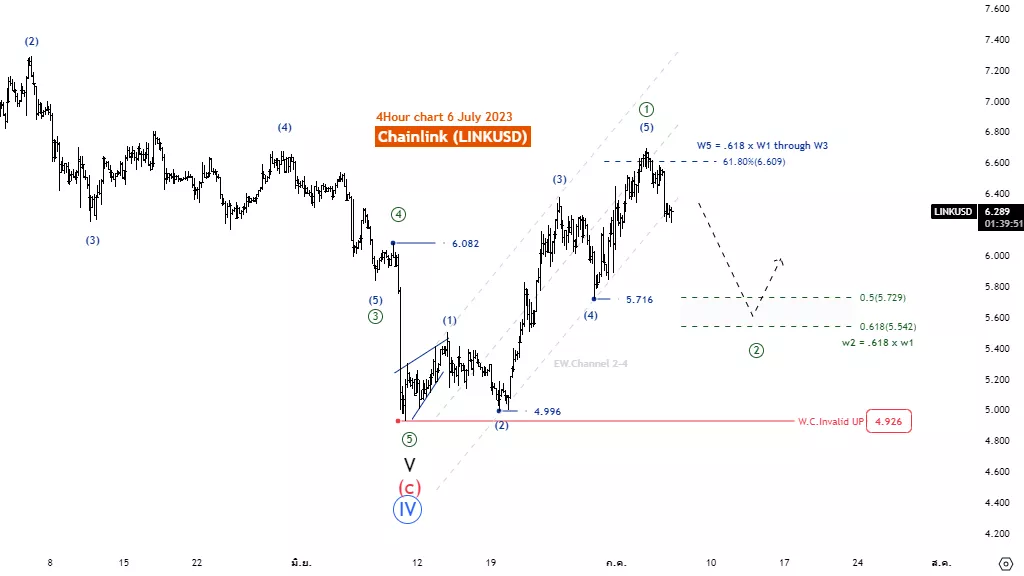
LINKUSD H4 Crypto Chart
Thursday 6 July 2023.
LINKUSD Elliott Wave Technical Analysis
Function: Follow trend
Mode: Motive
Structure: Impulse
Position: Wave (5)
Direction Next higher Degrees: Wave 1 of Motive
Details: Wave 5 is usually equal to .618 multiplied Length of wave 1 through wave 3
Wave Cancel invalid Level: 4.926
More By This Author:
Commodities Market Report Elliott Wave Analysis
Elliott Wave Technical Analysis: Spotify Inc. - Wednesday, July 5
Elliott Wave Technical Analysis: Cardano/U.S. Dollar - Wednesday, July 5


Comments
Log in or sign up to join the conversation.