

Image Source: Unsplash
Spotify Inc., Elliott Wave Technical Analysis
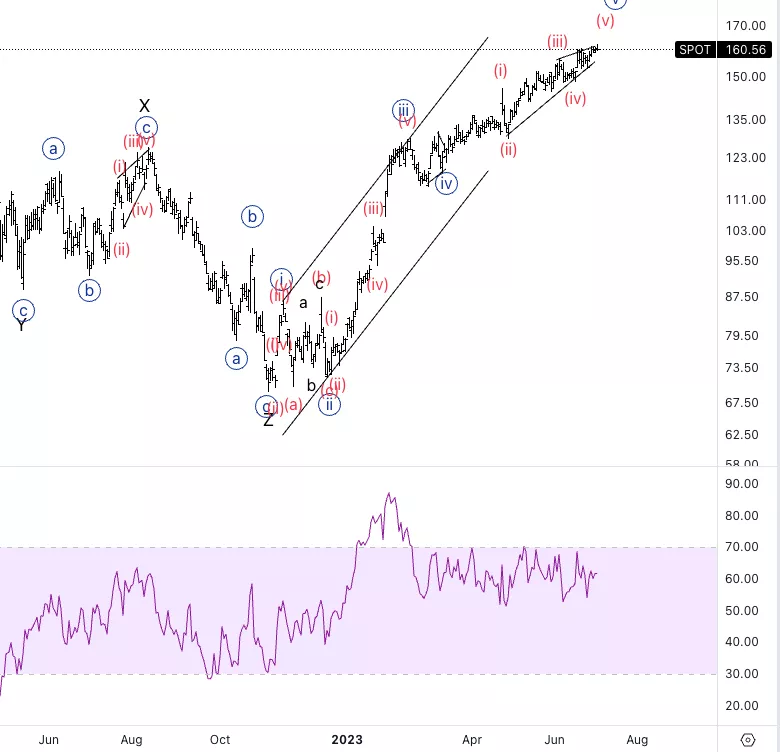
Spotify Inc., (Nasdaq: SPOT): Daily Chart, 5 July 2023
SPOT Stock Market Analysis: We have been monitoring the up move from the 70$ bottom for a while. It looks like we keep moving higher in what seems to be a wave {v} structure has RSI keeps failing to make higher highs.
SPOT Elliott Wave Count: Wave {v} of 1 or A.
SPOT Technical Indicators: Above all averages.
SPOT Trading Strategy: Looking for a sharp move down into wave {a} to then look for shorts in wave {c}.
Analyst: Alessio Barretta
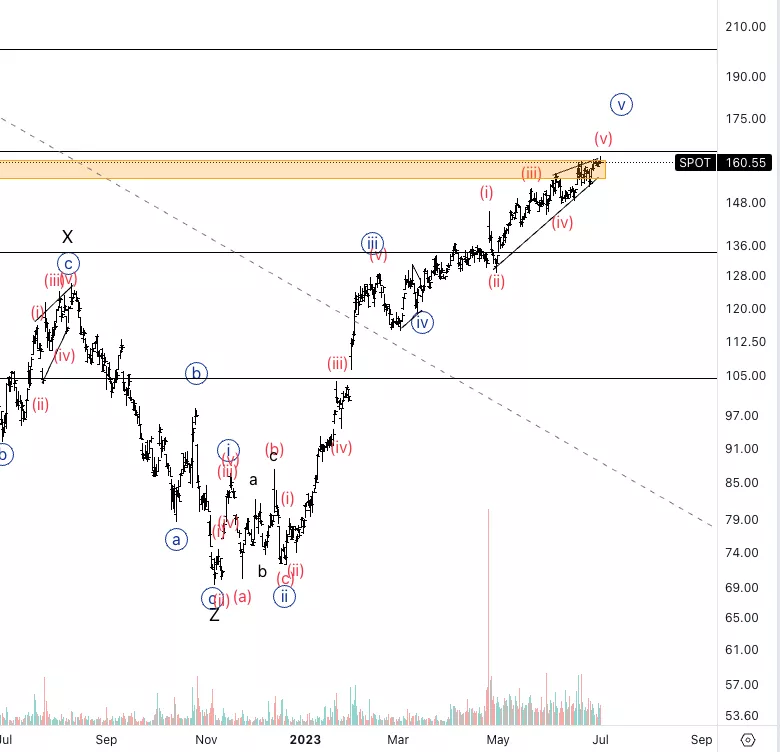
Spotify Inc., SPOT: 4-hour Chart, 5 July 2023.
Spotify Inc., Elliott Wave Technical Analysis
SPOT Stock Market Analysis: We reached previous resistance on the left where the yellow box is, as well as the 50% retracement of the entire move down from the ATH stands at 165$.
SPOT Elliott Wave count: Wave {v} of 1 or A.
SPOT Technical Indicators: Above all averages, volume increase during potential wave {v}.
SPOT Trading Strategy: Looking for a sharp move down to confirm wave {a} started.
More By This Author:
Elliott Wave Technical Analysis: Cardano/U.S. Dollar - Wednesday, July 5
Elliott Wave Technical Analysis: VeChain/U.S. Dollar - Tuesday, July 4
Tech Stocks Bullish Trend - Technical Analysis


Comments
Log in or sign up to join the conversation.